Datapods|Insights
Consumption
Online ShoppingProduct CategoriesRetailSocial Commerce
Digital
Web & BrowsingSearch QueriesApps & MobileAdvertising
Media
Video & StreamingSocial MediaTrends & TopicsUsage Behavior
Resources|For BusinessFor Consumers
Datapods|Insights
ConsumptionOnline ShoppingProduct CategoriesRetailSocial CommerceDigitalWeb & BrowsingSearch QueriesApps & MobileAdvertisingMediaVideo & StreamingSocial MediaTrends & TopicsUsage BehaviorResourcesFor BusinessFor Consumers
InsightsMediaUsage Behavior
Datapods

Talk to people who actually bought your product.

Use Cases

  • Churn & Win-Back
  • Product & Concept Testing
  • Ad & Creative Testing
  • Customer Journey
  • Competitive Intelligence
  • Audiences & Segmentation
  • Influencers & Creators

Industries

  • Grocery & Drugstore
  • CPG & Brands
  • E-Commerce & Marketplaces
  • Telco & Subscriptions
  • Media & Streaming
  • Apps & Digital

Platform

  • AI Research Agent
  • AI Interviewer
  • Quant Surveys
  • Audience Builder
  • Data API
  • Social Attribution

Company

  • Home
  • About
  • For Consumers
  • The Datapods Panel
  • Insights
  • Contact
  • Resources

Legal

  • Imprint
  • Privacy Policy
  • User Agreement App
  • Privacy Policy App
  • User Agreement Platform
  • Privacy Policy Platform
  • Cookie Policy

©2026 Datapods.app. All rights reserved.

EU Co-financedNRW

Public Action Concentration Among Voicers on TikTok and YouTube in Germany — 2025

Results as of 12.05.2026

Review Full Year 2025: The top 10% of YouTube voicers produce 83% of all public actions — even more concentrated than TikTok's already Pareto-skewed 77%
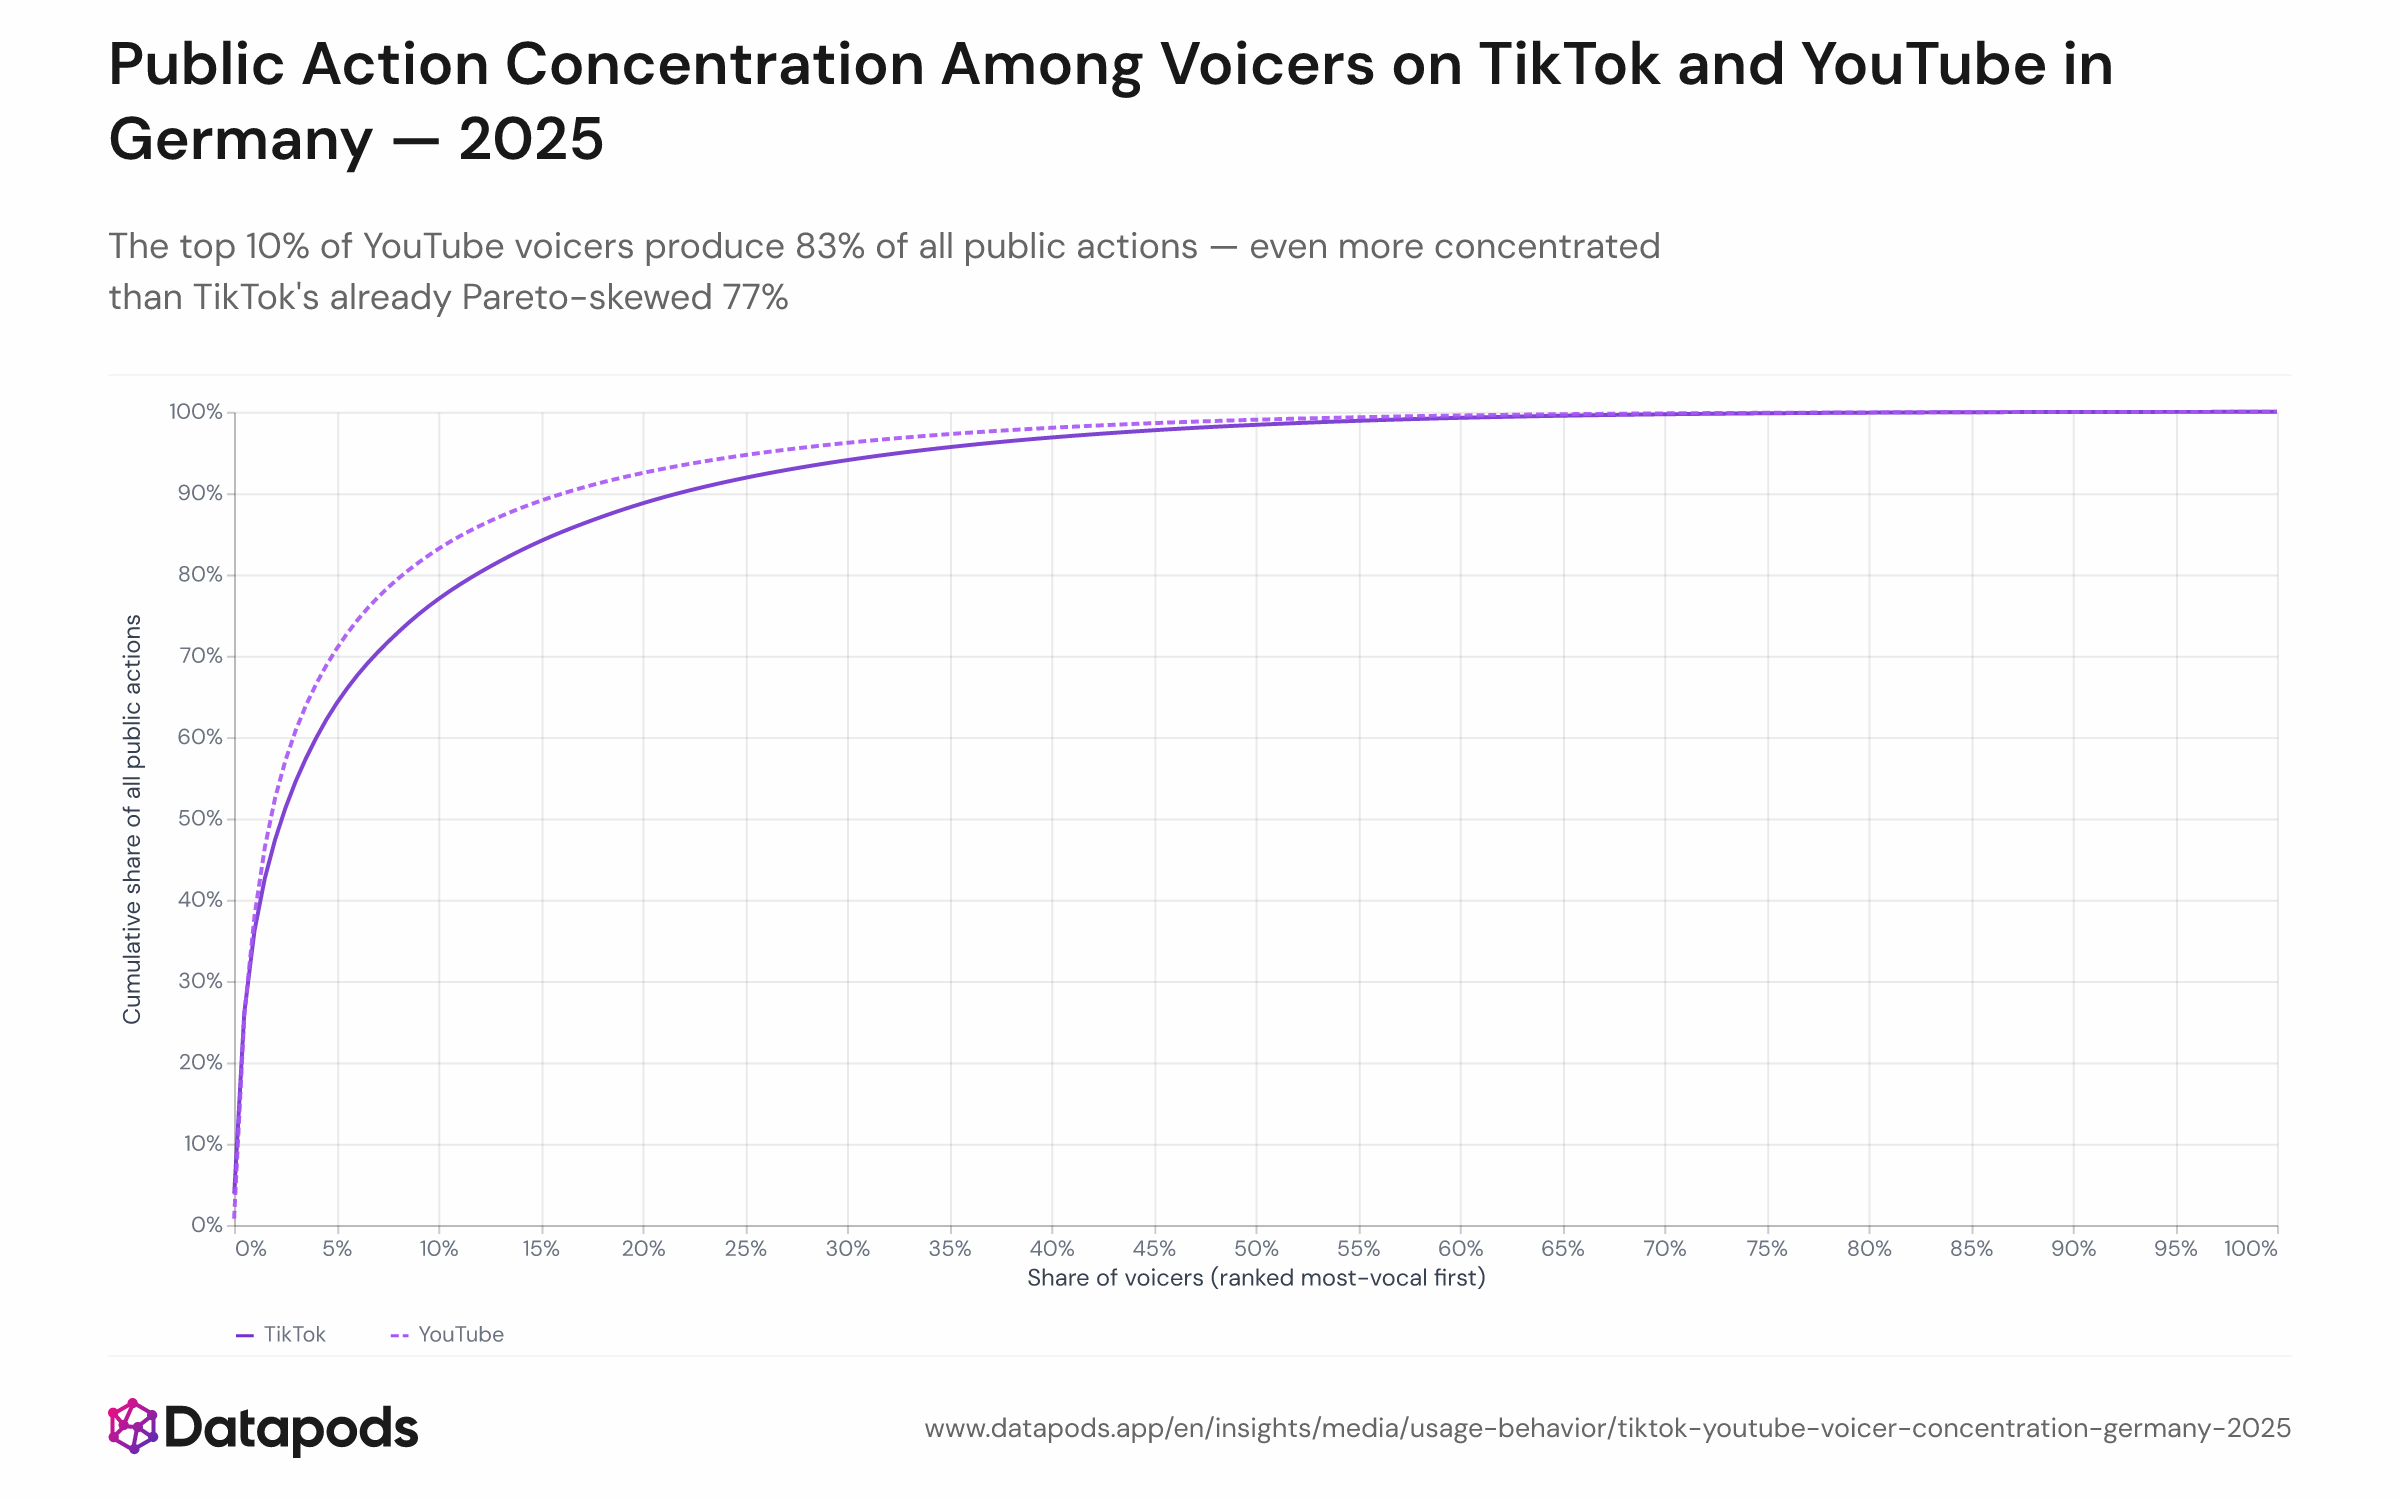
Public Action Concentration Among Voicers on TikTok and YouTube in Germany — 2025Cumulative concentration curve (Lorenz-style) showing the share of all 2025 public actions generated by the most-vocal top percentage of voicers, plotted separately for TikTok (7,958 voicers) and YouTube (20,737 voicers) among active German users. The x-axis shows the cumulative share of voicers ranked from most to least vocal; the y-axis shows their cumulative share of all public actions. Key markers: top 10% of voicers account for 77% (TikTok) and 83% (YouTube) of all public actions.Cumulative concentration curve (Lorenz-style) showing the share of all 2025 public actions generated by the most-vocal top percentage of voicers, plotted separately for TikTok (7,958 voicers) and YouTube (20,737 voicers) among active German users. The x-axis shows the cumulative share of voicers ranked from most to least vocal; the y-axis shows their cumulative share of all public actions. Key markers: top 10% of voicers account for 77% (TikTok) and 83% (YouTube) of all public actions.
Cumulative concentration curve (Lorenz-style) showing the share of all 2025 public actions generated by the most-vocal top percentage of voicers, plotted separately for TikTok (7,958 voicers) and YouTube (20,737 voicers) among active German users. The x-axis shows the cumulative share of voicers ranked from most to least vocal; the y-axis shows their cumulative share of all public actions. Key markers: top 10% of voicers account for 77% (TikTok) and 83% (YouTube) of all public actions.
Sample size
n = 28,695
Data date
Full Year 2025
Segment
All segments
Platform
TikTok, YouTube
Market
Germany
Info
Sample size
n = 28,695
Data date
Full Year 2025
Segment
All segments
Platform
TikTok, YouTube
Market
Germany

Analysis

Despite three-quarters of active users qualifying as voicers on both platforms, the actual production of public content is radically top-heavy: on YouTube, 83% of all likes, dislikes, and votes in 2025 were generated by just 10% of voicers — and 47% by the top 1% alone.

Platforms are democratic in reach but aristocratic in signal

The 90-9-1 rule's deeper truth survives even when the lurker share collapses: the concentration of public output among a tiny super-voicer minority is, if anything, steeper on today's mass-market platforms than in earlier web communities. YouTube's concentration (83% from the top decile) exceeds TikTok's (77%) despite YouTube having a far larger absolute voicer base of 20,737 users. This counterintuitive result likely reflects YouTube's like-driven voicing mechanic: the same small group of highly engaged users who watch the most content also generate the most likes, creating a compounding loop. TikTok's comment-and-post layer, though rarer in absolute terms, distributes somewhat more evenly among those who use it — suggesting that composition-based actions attract a broader motivated minority than a single-tap reaction. For marketers reading sentiment from comment sections or like ratios, both platforms' public signals are effectively the voice of a tiny, unrepresentative super-user layer. See also how voicer rates break down by platform and age group.


This analysis is based on public segment data. For deeper cuts, use our Enterprise interface.

Related statistics

See all Usage Behavior
  • Spotify vs. Amazon Music: Reach by Age Group

    Q1 2026
  • Unlock deeper cuts

    Enterprise
  • Spotify Users Open the App 2.5× More Than Amazon Music

    Q1 2026
  • GfK Consumer Confidence vs. Digital Frugality Signals in Germany — Scatter Plot, Jan 2025–Apr 2026

    Jan 2025–Apr 2026
See all Usage Behavior

Methodology

The concentration analysis was conducted within the voicer subset — users who produced at least one public action during 2025 — on each platform: 7,958 TikTok voicers and 20,737 YouTube voicers among active German users. Voicers were ranked from highest to lowest total public-action count. Cumulative public-action shares were then calculated at each percentile rank to produce a Lorenz-style concentration curve. The curves were downsampled to 200 data points each for display. Top-1% and top-10% thresholds are read directly from the cumulative curve. The within-platform concentration metric is not sensitive to the overall composition of the panel.


These insights are based on the Datapods Panel. Our data comes exclusively from users who are compensated for their anonymity. Become part of the panel & earn from your data