Datapods|Insights
Consumption
Online ShoppingProduct CategoriesRetailSocial Commerce
Digital
Web & BrowsingSearch QueriesApps & MobileAdvertising
Media
Video & StreamingSocial MediaTrends & TopicsUsage Behavior
Resources|For BusinessFor Consumers
Datapods|Insights
ConsumptionOnline ShoppingProduct CategoriesRetailSocial CommerceDigitalWeb & BrowsingSearch QueriesApps & MobileAdvertisingMediaVideo & StreamingSocial MediaTrends & TopicsUsage BehaviorResourcesFor BusinessFor Consumers
InsightsMediaUsage Behavior
Datapods

Talk to people who actually bought your product.

Use Cases

  • Churn & Win-Back
  • Product & Concept Testing
  • Ad & Creative Testing
  • Customer Journey
  • Competitive Intelligence
  • Audiences & Segmentation
  • Influencers & Creators

Industries

  • Grocery & Drugstore
  • CPG & Brands
  • E-Commerce & Marketplaces
  • Telco & Subscriptions
  • Media & Streaming
  • Apps & Digital

Platform

  • AI Research Agent
  • AI Interviewer
  • Quant Surveys
  • Audience Builder
  • Social Attribution

Company

  • Home
  • About
  • For Consumers
  • The Datapods Panel
  • Insights
  • Contact
  • Resources

Legal

  • Imprint
  • Privacy Policy
  • User Agreement App
  • Privacy Policy App
  • User Agreement Platform
  • Privacy Policy Platform
  • Cookie Policy

©2026 Datapods.app. All rights reserved.

EU Co-financedNRW

Spotify Users Open the App 2.5× More Than Amazon Music

Results as of 16.07.2026

Review Q1 2026: Active Spotify users in Germany open the app 2.5× more often per week than Amazon Music users — the largest engagement gap among all tracked audio-streaming apps in Q1 2026.
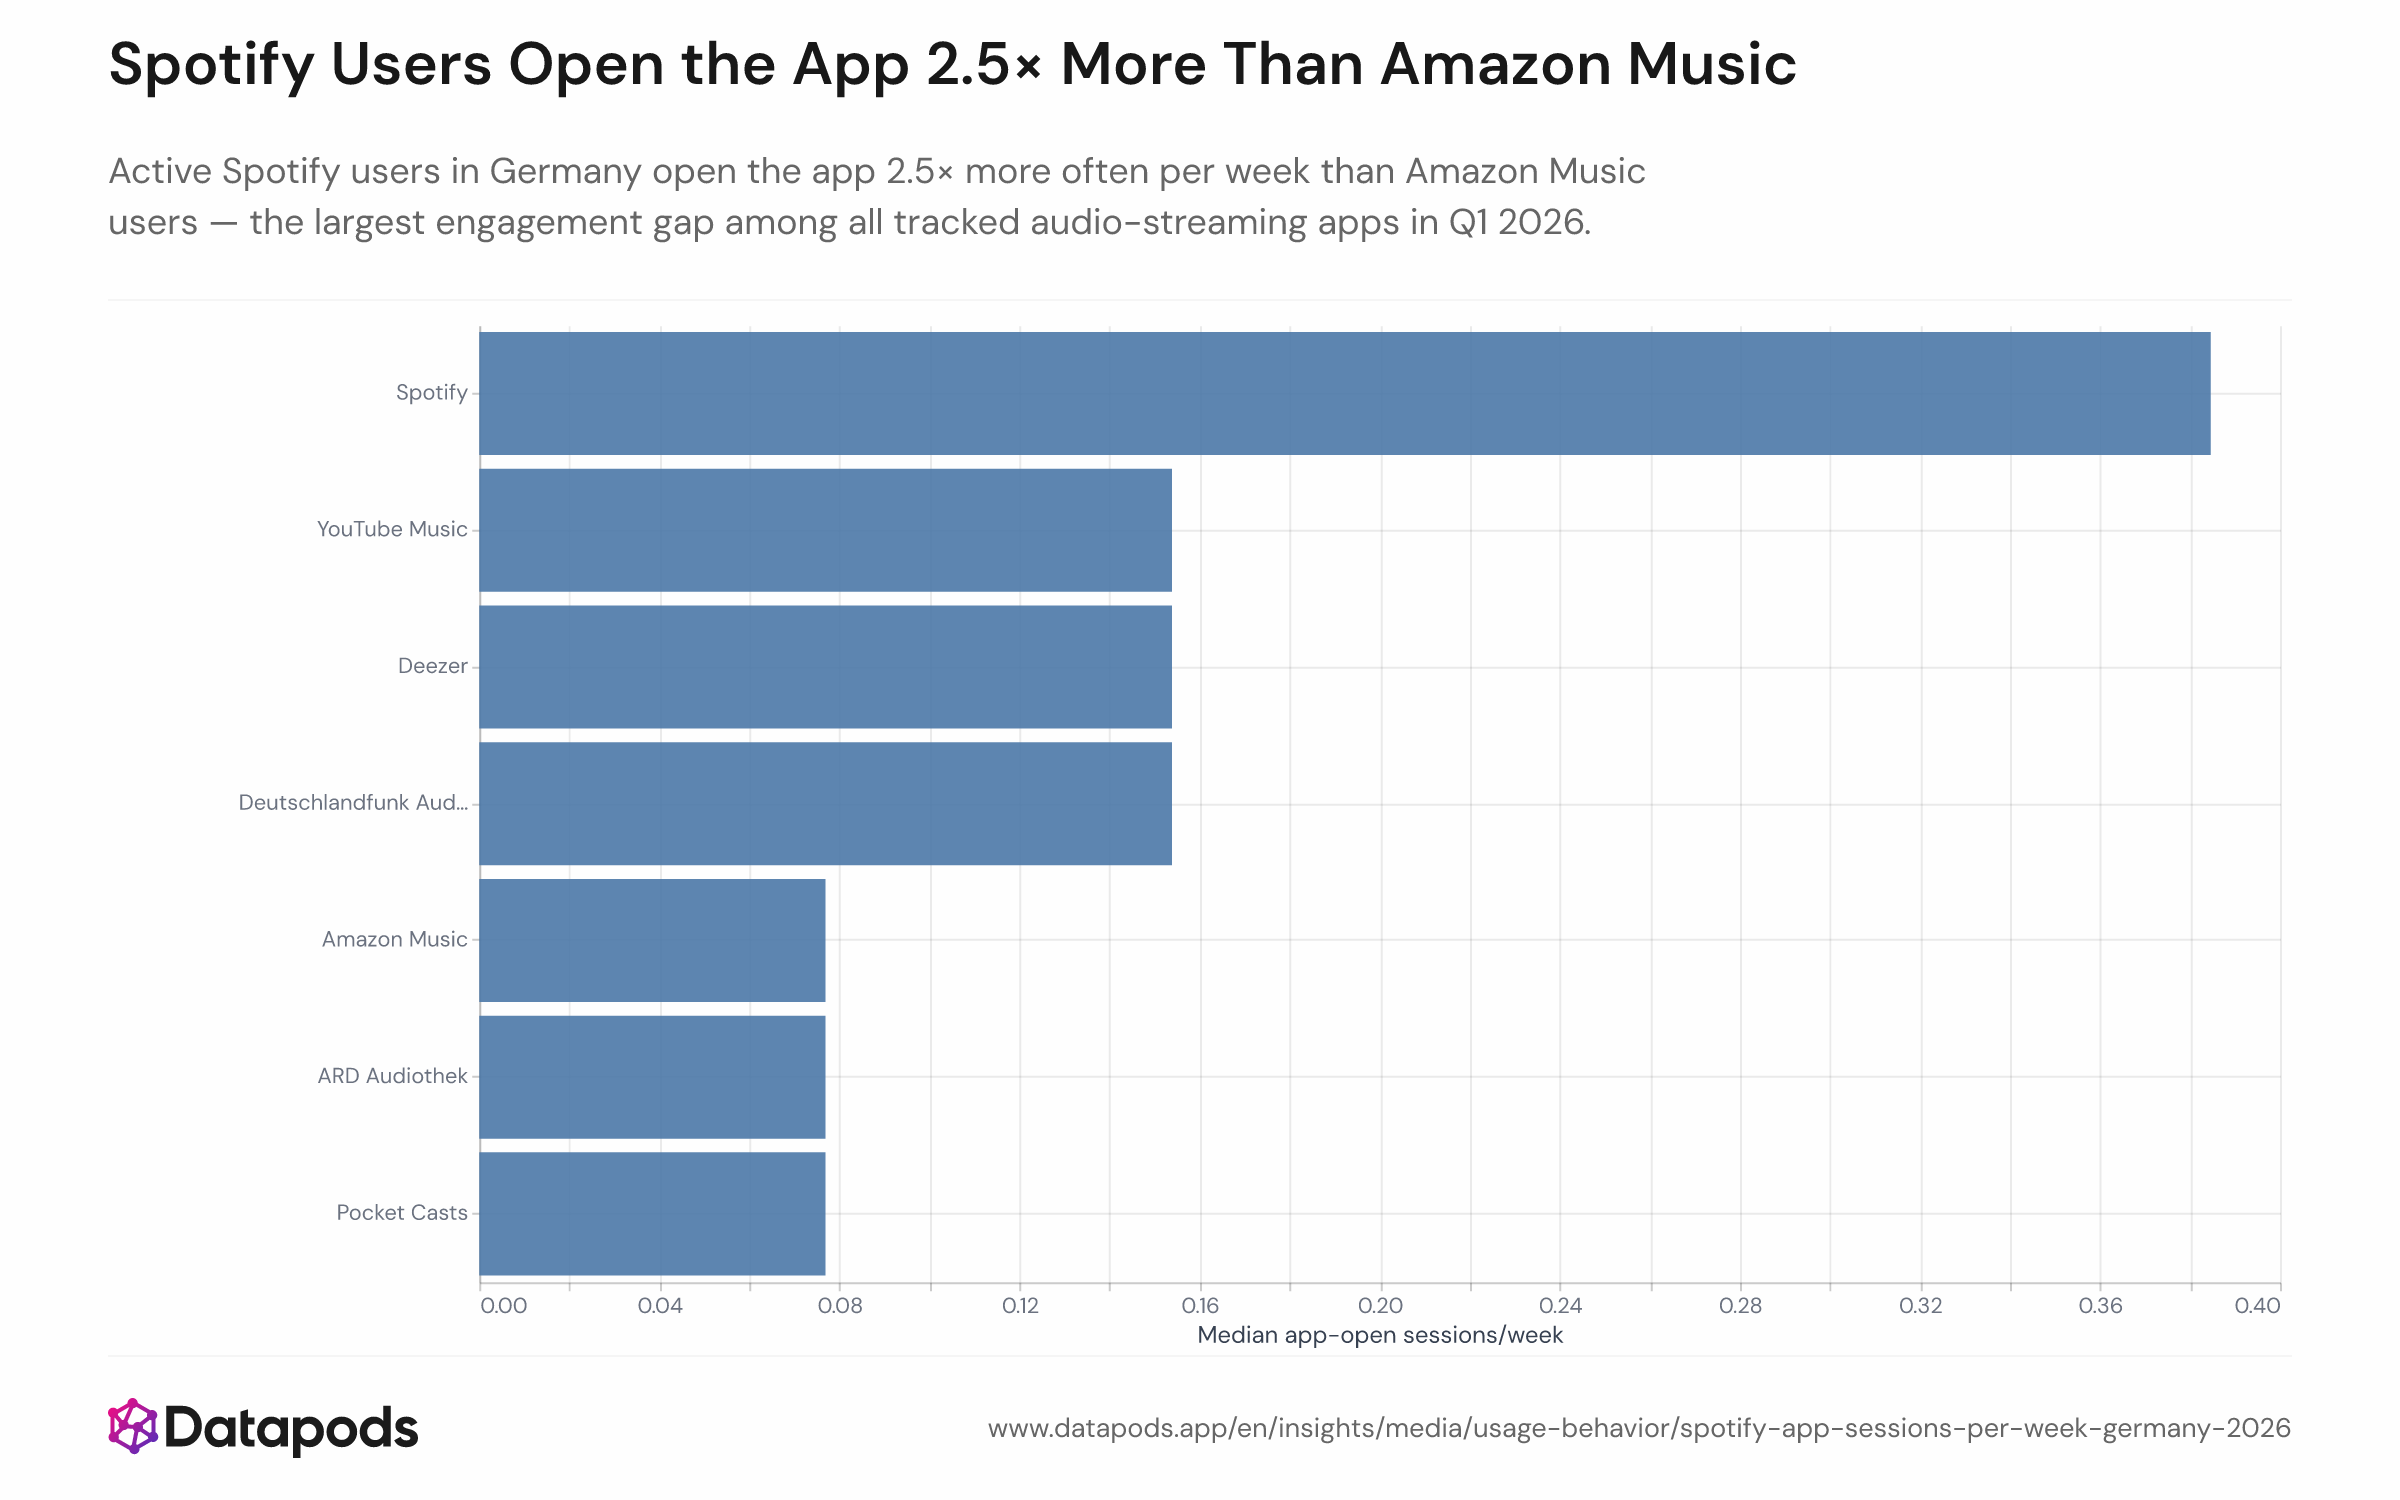
Spotify Users Open the App 2.5× More Than Amazon MusicBar chart showing median weekly app-open sessions among active users of each audio-streaming app in Germany, Q1 2026. Spotify records the highest median, approximately 2.5× that of Amazon Music. Additional bars show YouTube Music, ARD Audiothek, Deezer, and Pocket Casts at progressively lower session frequencies.Bar chart showing median weekly app-open sessions among active users of each audio-streaming app in Germany, Q1 2026. Spotify records the highest median, approximately 2.5× that of Amazon Music. Additional bars show YouTube Music, ARD Audiothek, Deezer, and Pocket Casts at progressively lower session frequencies.
Bar chart showing median weekly app-open sessions among active users of each audio-streaming app in Germany, Q1 2026. Spotify records the highest median, approximately 2.5× that of Amazon Music. Additional bars show YouTube Music, ARD Audiothek, Deezer, and Pocket Casts at progressively lower session frequencies.
Sample size
n = 12,009
Data date
Q1 2026
Segment
All segments
Platform
Play
Market
Germany
Info
Sample size
n = 12,009
Data date
Q1 2026
Segment
All segments
Platform
Play
Market
Germany

Analysis

Weekly session frequency separates passive installs from genuine listening habits. Spotify's median weekly app-open rate being 2.5× higher than Amazon Music's is striking because it persists even among users who have consciously chosen to install and use both products.

Habitual listening vs. bundled convenience

Amazon Music's lower session frequency is consistent with its positioning as a bundled Prime benefit: users install it alongside a Prime subscription but return to it less reflexively than to Spotify, which they downloaded by deliberate choice. The gap has direct implications for podcast advertisers: higher open frequency translates to more ad-exposure opportunities per listener per week. Smaller platforms like ARD Audiothek and Pocket Casts, though niche in reach, show session intensities among their active users that suggest dedicated, routine audiences.


This analysis is based on public segment data. For deeper cuts, use our Enterprise interface.

Related statistics

See all Usage Behavior
  • Spotify vs. Amazon Music: Reach by Age Group

    Q1 2026
  • Unlock deeper cuts

    Enterprise
  • GfK Consumer Confidence vs. Digital Frugality Signals in Germany — Scatter Plot, Jan 2025–Apr 2026

    Jan 2025–Apr 2026
  • Public Action Concentration Among Voicers on TikTok and YouTube in Germany — 2025

    Full Year 2025
See all Usage Behavior

Methodology

Median weekly app-open sessions are calculated from Android app-open and in-use events recorded over Q1 2026 (13 weeks), divided by 13 to arrive at a weekly figure. Each app-open event is treated as one session. This metric reflects the active users of each app — those who opened it at least once during the quarter — not all installed users. Only Android data is available for this metric; iOS does not expose app-launch telemetry. Apps with fewer than 25 active Android users in Q1 2026 are excluded. This is an engagement intensity measure among each app's own users, not a population-level estimate.


These insights are based on the Datapods Panel. Our data comes exclusively from users who are compensated for their anonymity. Become part of the panel & earn from your data