Datapods|Insights
Consumption
Online ShoppingProduct CategoriesRetailSocial Commerce
Digital
Web & BrowsingSearch QueriesApps & MobileAdvertising
Media
Video & StreamingSocial MediaTrends & TopicsUsage Behavior
Blog|For BusinessFor Consumers
Datapods|Insights
ConsumptionOnline ShoppingProduct CategoriesRetailSocial CommerceDigitalWeb & BrowsingSearch QueriesApps & MobileAdvertisingMediaVideo & StreamingSocial MediaTrends & TopicsUsage BehaviorBlogFor BusinessFor Consumers
InsightsConsumptionSocial Commerce
Datapods

Talk to people who actually bought your product.

Use Cases

  • Churn & Win-Back
  • Product & Concept Testing
  • Ad & Creative Testing
  • Customer Journey
  • Competitive Intelligence
  • Audiences & Segmentation
  • Influencers & Creators

Industries

  • Grocery & Drugstore
  • CPG & Brands
  • E-Commerce & Marketplaces
  • Telco & Subscriptions
  • Media & Streaming
  • Apps & Digital

Platform

  • AI Research Agent
  • AI Interviewer
  • Quant Surveys
  • Audience Builder
  • Data API
  • Social Attribution

Company

  • Home
  • About
  • For Consumers
  • The Datapods Panel
  • Insights
  • Contact
  • Blog

Legal

  • Imprint
  • Privacy Policy
  • User Agreement App
  • Privacy Policy App
  • User Agreement Platform
  • Privacy Policy Platform
  • Cookie Policy

©2026 Datapods.app. All rights reserved.

EU Co-financedNRW

TikTok Shop vs Amazon.de Order Behavior Among German Shoppers — Q1 2026

Results as of 03.05.2026

Review Q1 2026: 72.2% of German TikTok Shop browsers also ordered on Amazon.de in Q1 2026 — virtually identical to the 72.9% of TikTok users who never opened the Shop
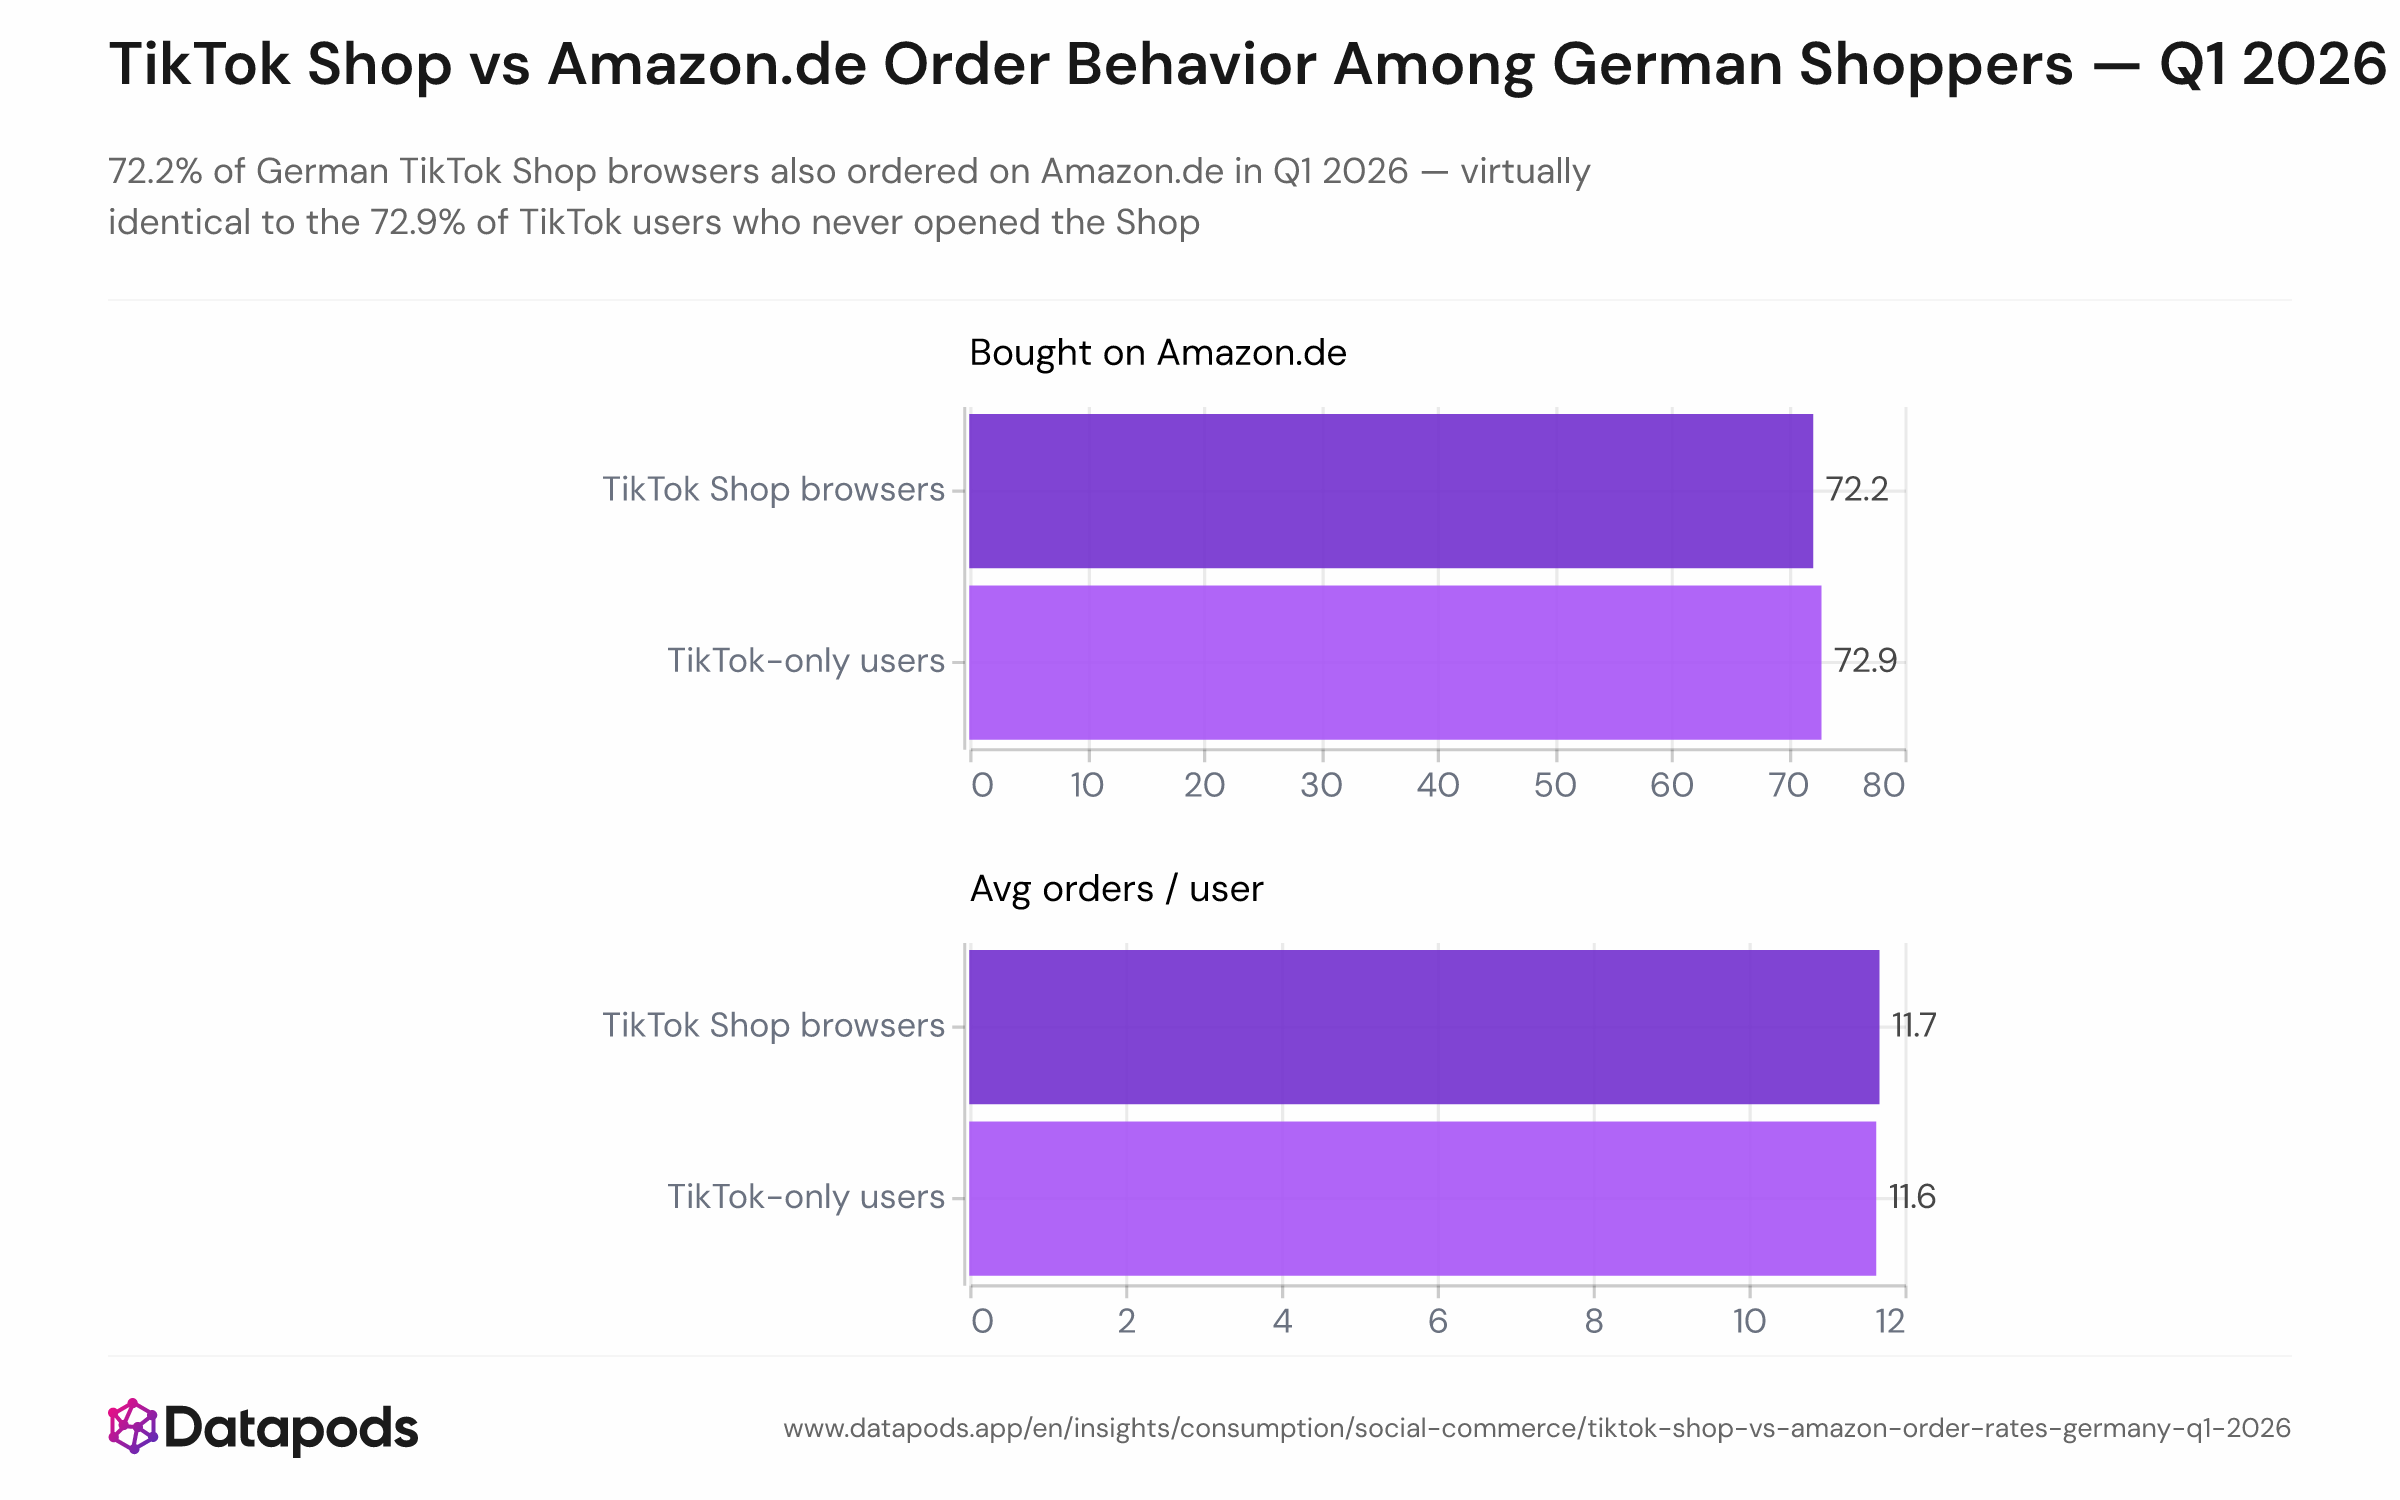
TikTok Shop vs Amazon.de Order Behavior Among German Shoppers — Q1 2026Side-by-side bar chart comparing two groups of German dual-platform users in Q1 2026: TikTok Shop browsers (n=1,725) and TikTok-only users (n=1,258). For each group, two metrics are shown: Amazon.de buy rate (72.2% vs. 72.9%) and average Amazon.de orders per user per quarter (11.68 vs. 11.64).Side-by-side bar chart comparing two groups of German dual-platform users in Q1 2026: TikTok Shop browsers (n=1,725) and TikTok-only users (n=1,258). For each group, two metrics are shown: Amazon.de buy rate (72.2% vs. 72.9%) and average Amazon.de orders per user per quarter (11.68 vs. 11.64).
Side-by-side bar chart comparing two groups of German dual-platform users in Q1 2026: TikTok Shop browsers (n=1,725) and TikTok-only users (n=1,258). For each group, two metrics are shown: Amazon.de buy rate (72.2% vs. 72.9%) and average Amazon.de orders per user per quarter (11.68 vs. 11.64).
Sample size
n = 2,983
Data date
Q1 2026
Segment
16-24, 25-34, 35-44, 45-54, 55+
Platform
Amazon, TikTok
Market
Germany
Info
Sample size
n = 2,983
Data date
Q1 2026
Segment
16-24, 25-34, 35-44, 45-54, 55+
Platform
Amazon, TikTok
Market
Germany

Analysis

German TikTok Shop browsers placed Amazon.de orders at a rate of 72.2% in Q1 2026 — just 0.7 percentage points below the 72.9% rate of TikTok users who did not browse the Shop at all. Average Amazon order counts per user were effectively equal at 11.68 versus 11.64. The data shows TikTok Shop operating as an additive channel in Germany, not a substitute for Amazon.

What the 'TikTok eats Amazon' thesis gets wrong in Germany

A year after TikTok Shop's German debut, the fear that social commerce would cannibalise established marketplaces like Amazon.de has not materialized in purchase-frequency data. Median quarterly Amazon spend is modestly lower among TikTok Shop browsers (€60.80 vs. €72.90) while order counts are identical — pointing to TikTok Shop capturing smaller, impulse-driven purchases rather than displacing considered Amazon orders. This complementarity mirrors the US picture: research suggests that 97% of US TikTok shoppers also shopped on Amazon in the past year. Germany's e-commerce market, where Amazon holds a dominant position, appears to be adding TikTok Shop as a discovery and entertainment layer rather than rerouting spending away from it. Brands planning a dual-channel strategy can treat TikTok Shop Germany as an acquisition surface and Amazon.de as the retention and repurchase engine — the audiences overlap almost entirely. For the category-level browsing picture that underpins this finding, see TikTok Shop category reach among German shoppers.


This analysis is based on public segment data. For deeper cuts, use our Enterprise interface.

Related statistics

See all Social Commerce
  • TikTok Shop Category Reach Among German Shoppers — Q1 2026

    Q1 2026
  • Brand Switching on Amazon.de by Category

    2024–2025
  • Unlock deeper cuts

    Enterprise
  • Amazon.de Brand-Switch Rate by Quarter

    Q1 2024 – Q4 2025
See all Social Commerce

Methodology

The comparison is limited to 2,983 German TikTok users who were active on both TikTok and Amazon.de during Q1 2026 (January–March), split into TikTok Shop browsers (1,725 users) and TikTok-only users who did not browse the Shop (1,258 users). Amazon buy rate is the share of each group who placed at least one Amazon.de order during the quarter. Order count is the average number of Amazon.de orders per user across the same period. Restricting both groups to dual-platform users ensures that differences in Amazon coverage do not inflate one group's apparent buy rate.


These insights are based on the Datapods Panel. Our data comes exclusively from users who are compensated for their anonymity. Become part of the panel & earn from your data