Datapods|Insights
Consumption
Online ShoppingProduct CategoriesRetailSocial Commerce
Digital
Web & BrowsingSearch QueriesApps & MobileAdvertising
Media
Video & StreamingSocial MediaTrends & TopicsUsage Behavior
Resources|For BusinessFor Consumers
Datapods|Insights
ConsumptionOnline ShoppingProduct CategoriesRetailSocial CommerceDigitalWeb & BrowsingSearch QueriesApps & MobileAdvertisingMediaVideo & StreamingSocial MediaTrends & TopicsUsage BehaviorResourcesFor BusinessFor Consumers
InsightsConsumptionSocial Commerce
Datapods

Talk to people who actually bought your product.

Use Cases

  • Churn & Win-Back
  • Product & Concept Testing
  • Ad & Creative Testing
  • Customer Journey
  • Competitive Intelligence
  • Audiences & Segmentation
  • Influencers & Creators

Industries

  • Grocery & Drugstore
  • CPG & Brands
  • E-Commerce & Marketplaces
  • Telco & Subscriptions
  • Media & Streaming
  • Apps & Digital

Platform

  • AI Research Agent
  • AI Interviewer
  • Quant Surveys
  • Audience Builder
  • Data API
  • Social Attribution

Company

  • Home
  • About
  • For Consumers
  • The Datapods Panel
  • Insights
  • Contact
  • Resources

Legal

  • Imprint
  • Privacy Policy
  • User Agreement App
  • Privacy Policy App
  • User Agreement Platform
  • Privacy Policy Platform
  • Cookie Policy

©2026 Datapods.app. All rights reserved.

EU Co-financedNRW

Follower Size vs. Customer Affinity: Flat Across Tiers

Results as of 15.07.2026

Review June 2025 – June 2026: Median purchase lift stays within 1.75×–3.50× across all follower tiers for Adidas, ESN, and REWE — mega-reach is the strongest tier for none of them
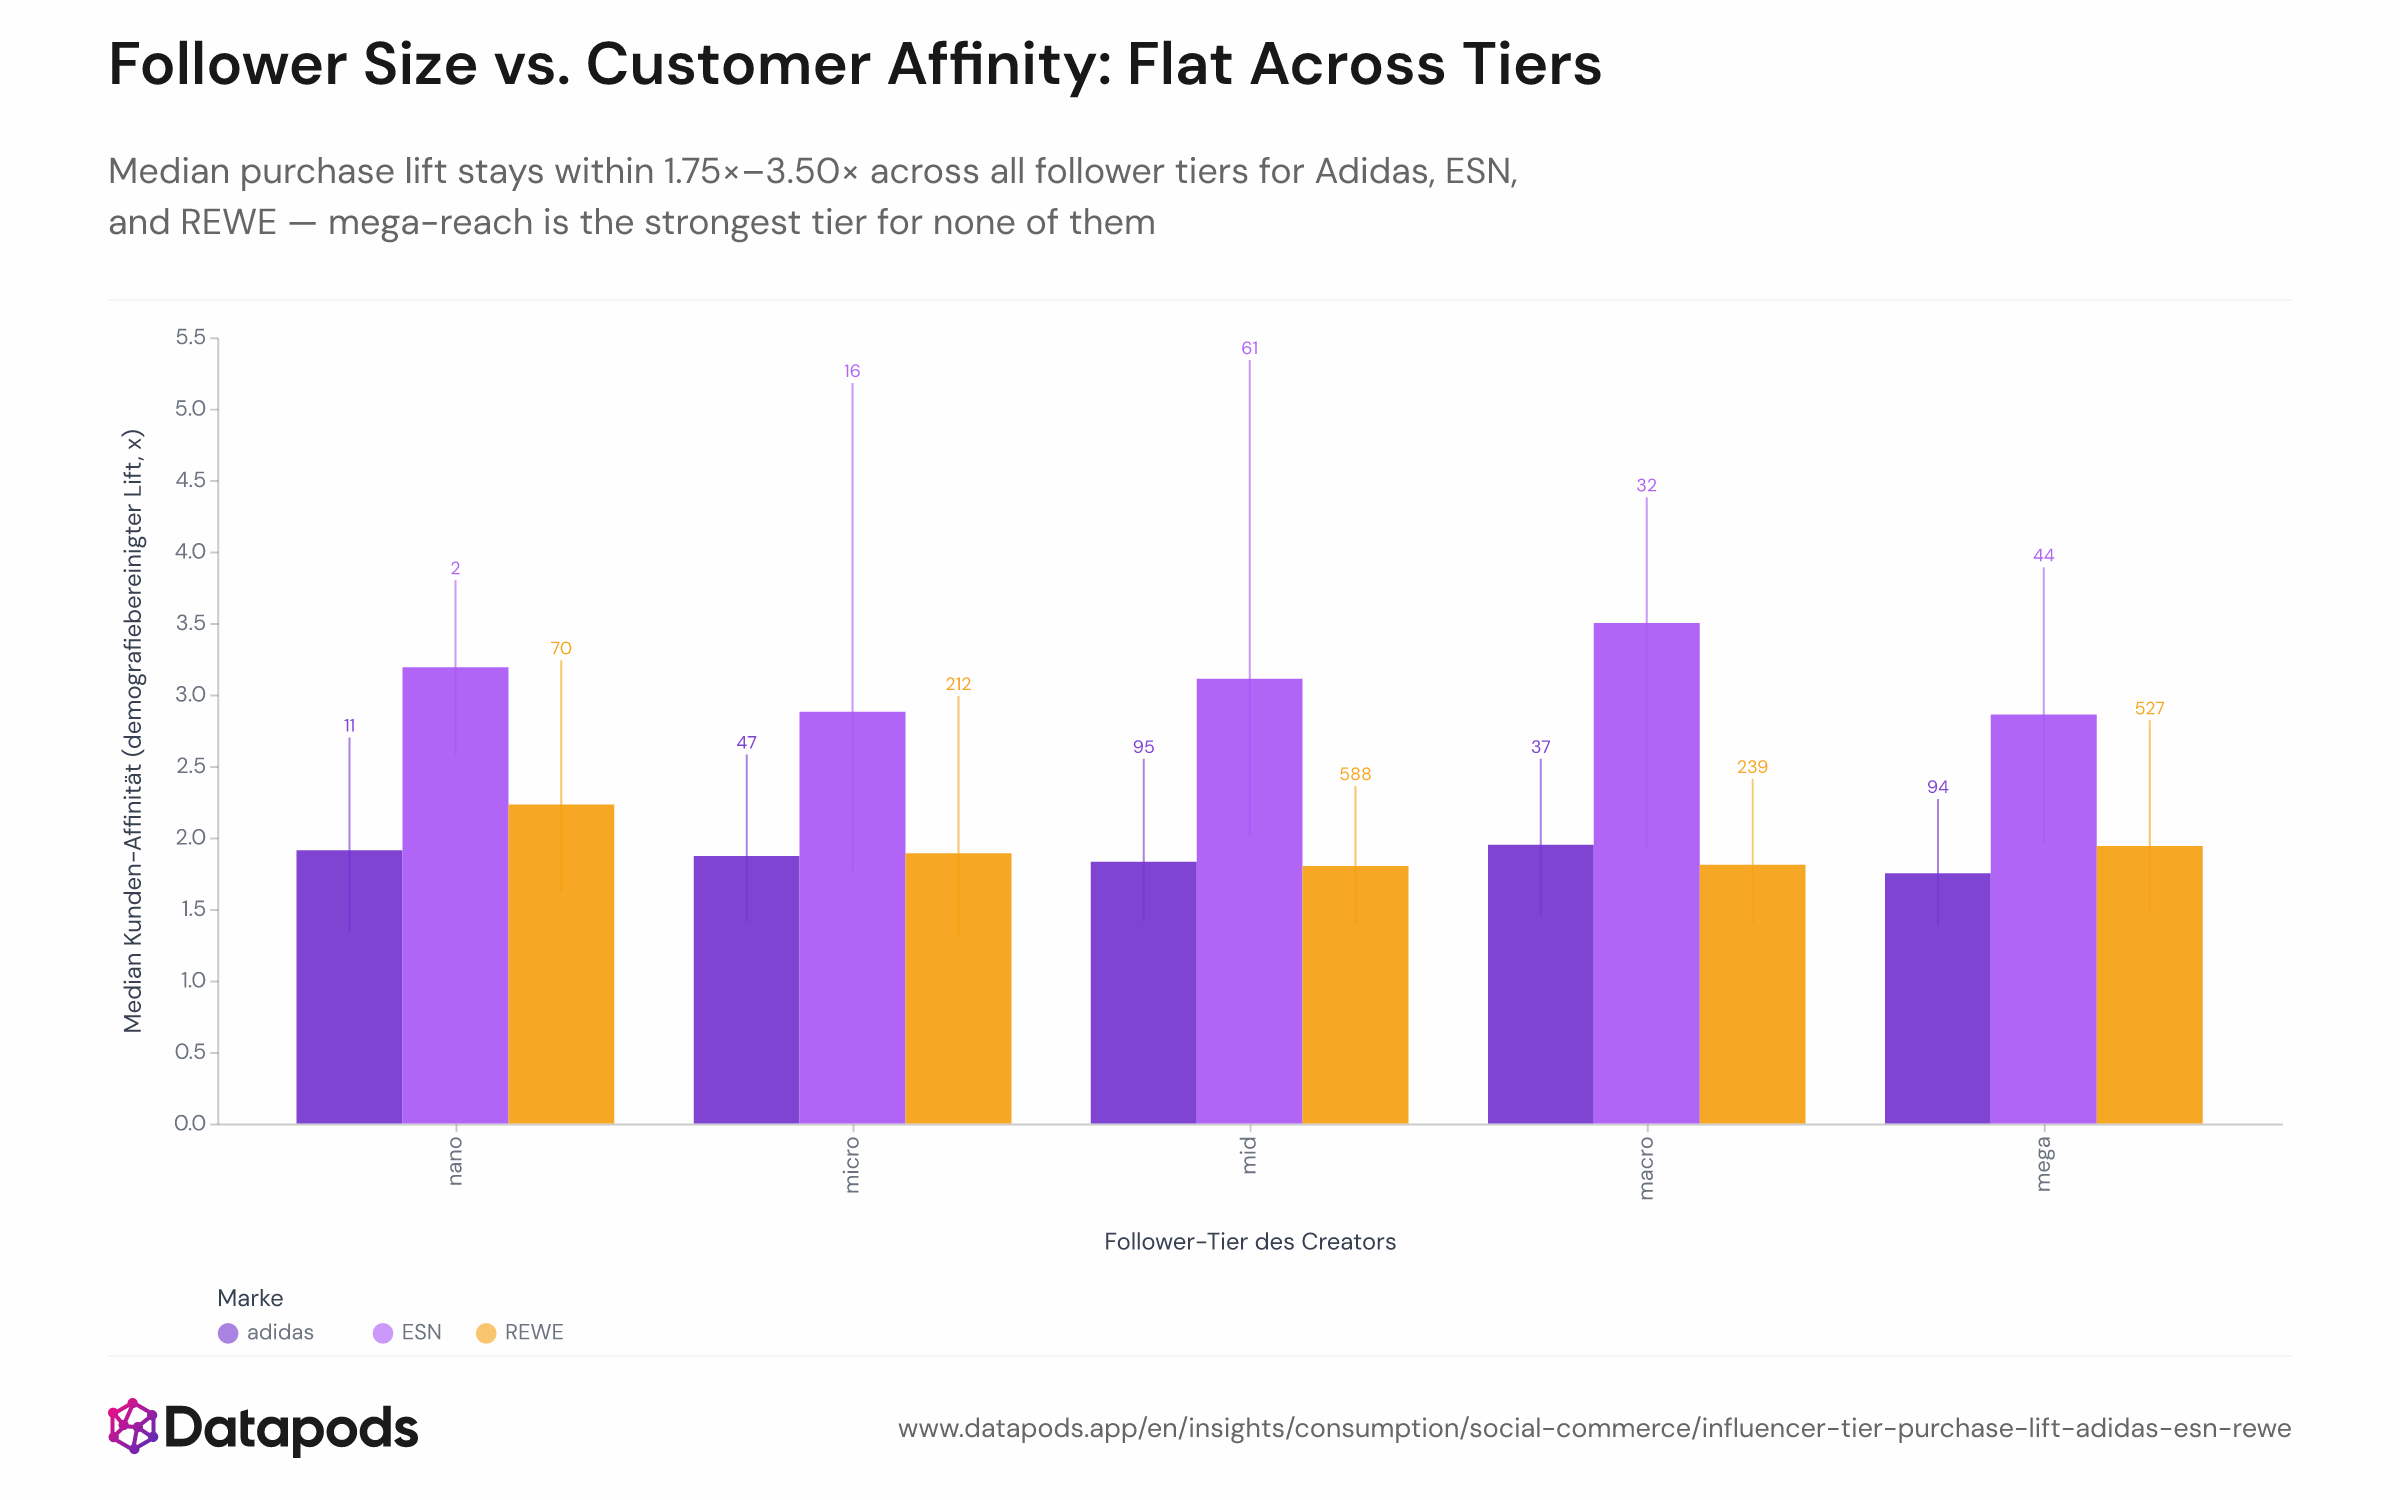
Follower Size vs. Customer Affinity: Flat Across TiersGrouped bar chart showing median demographics-adjusted purchase lift (y-axis) by follower tier (nano to mega, x-axis) for three brands — Adidas, ESN, and REWE — each represented by a distinct colour. Error bars indicate the 25th–75th percentile range; the number of creator candidates per bar is annotated on the chart. The observation period is June 2025 to June 2026.Grouped bar chart showing median demographics-adjusted purchase lift (y-axis) by follower tier (nano to mega, x-axis) for three brands — Adidas, ESN, and REWE — each represented by a distinct colour. Error bars indicate the 25th–75th percentile range; the number of creator candidates per bar is annotated on the chart. The observation period is June 2025 to June 2026.
Grouped bar chart showing median demographics-adjusted purchase lift (y-axis) by follower tier (nano to mega, x-axis) for three brands — Adidas, ESN, and REWE — each represented by a distinct colour. Error bars indicate the 25th–75th percentile range; the number of creator candidates per bar is annotated on the chart. The observation period is June 2025 to June 2026.
Sample size
n = 3,876
Data date
June 2025 – June 2026
Segment
All segments
Platform
Browsing, Purchases
Market
Germany
Info
Sample size
n = 3,876
Data date
June 2025 – June 2026
Segment
All segments
Platform
Browsing, Purchases
Market
Germany

Analysis

Across more than 3,800 creator candidates assessed for Adidas, ESN, and REWE, median purchase lift is remarkably stable from nano to mega tier — contradicting the widespread belief that smaller creators reliably out-convert their larger counterparts at the point of sale.

The nano-advantage narrative doesn't survive the full distribution

The industry consensus in 2025–2026 strongly favours nano and micro creators, pointing to engagement rates of 4–8% versus under 1% for mega accounts. But engagement and actual purchase conversion are different signals. When demographics-adjusted purchase lift is measured across the entire candidate pool — not cherry-picked examples — the tier gap shrinks to noise. For Adidas (nano–mega range: 1.75×–1.95×) and ESN (2.86×–3.50×), statistical testing confirms no significant tier effect. REWE shows a statistically detectable difference, but the spread (1.80×–2.23×) is small in commercial terms. The extreme individual lifts of 6×–12× sometimes cited for small creators are right-tail outliers, not the typical result in their segment. For brands negotiating creator fees, this means follower count alone is a weak proxy for expected audience affinity — creator-to-brand fit and audience overlap quality matter more than tier.


This analysis is based on public segment data. For deeper cuts, use our Enterprise interface.

Related statistics

See all Social Commerce
  • TikTok Shop Category Reach Among German Shoppers — Q1 2026

    Q1 2026
  • TikTok Shop vs Amazon.de Order Behavior Among German Shoppers — Q1 2026

    Q1 2026
  • Unlock deeper cuts

    Enterprise
  • Home & Garden: Interest-to-Purchase Gap

    H1 2026
See all Social Commerce

Methodology

Purchase lift was measured for all creator candidates evaluated for Adidas, ESN, and REWE using a creator–audience affinity model that identifies creators whose followers over-index on actual brand purchases. Lift figures are demographics-adjusted (age × gender) based on 12-month purchase and follow behaviour among verified brand buyers. Each creator was assigned to a follower tier (nano, micro, mid, macro, mega) using a standardised classification. The chart shows median lift and the interquartile range per tier and brand; candidate counts per cell are indicated on the chart. The observation window covers June 2025 to June 2026.


These insights are based on the Datapods Panel. Our data comes exclusively from users who are compensated for their anonymity. Become part of the panel & earn from your data