Datapods|Insights
Consumption
Online ShoppingProduct CategoriesRetailSocial Commerce
Digital
Web & BrowsingSearch QueriesApps & MobileAdvertising
Media
Video & StreamingSocial MediaTrends & TopicsUsage Behavior
Resources|For BusinessFor Consumers
Datapods|Insights
ConsumptionOnline ShoppingProduct CategoriesRetailSocial CommerceDigitalWeb & BrowsingSearch QueriesApps & MobileAdvertisingMediaVideo & StreamingSocial MediaTrends & TopicsUsage BehaviorResourcesFor BusinessFor Consumers
InsightsMediaUsage Behavior
Datapods

Talk to people who actually bought your product.

Use Cases

  • Churn & Win-Back
  • Product & Concept Testing
  • Ad & Creative Testing
  • Customer Journey
  • Competitive Intelligence
  • Audiences & Segmentation
  • Influencers & Creators

Industries

  • Grocery & Drugstore
  • CPG & Brands
  • E-Commerce & Marketplaces
  • Telco & Subscriptions
  • Media & Streaming
  • Apps & Digital

Platform

  • AI Research Agent
  • AI Interviewer
  • Quant Surveys
  • Audience Builder
  • Data API
  • Social Attribution

Company

  • Home
  • About
  • For Consumers
  • The Datapods Panel
  • Insights
  • Contact
  • Resources

Legal

  • Imprint
  • Privacy Policy
  • User Agreement App
  • Privacy Policy App
  • User Agreement Platform
  • Privacy Policy Platform
  • Cookie Policy

©2026 Datapods.app. All rights reserved.

EU Co-financedNRW

TikTok vs. YouTube Engagement Tier Mix by Age Group — 2025

Results as of 12.05.2026

Review Full Year 2025: TikTok's Voicer share nearly doubles from 9.7% (18–24) to 18.5% (55+); YouTube's stays flat at 5–8% across all ages
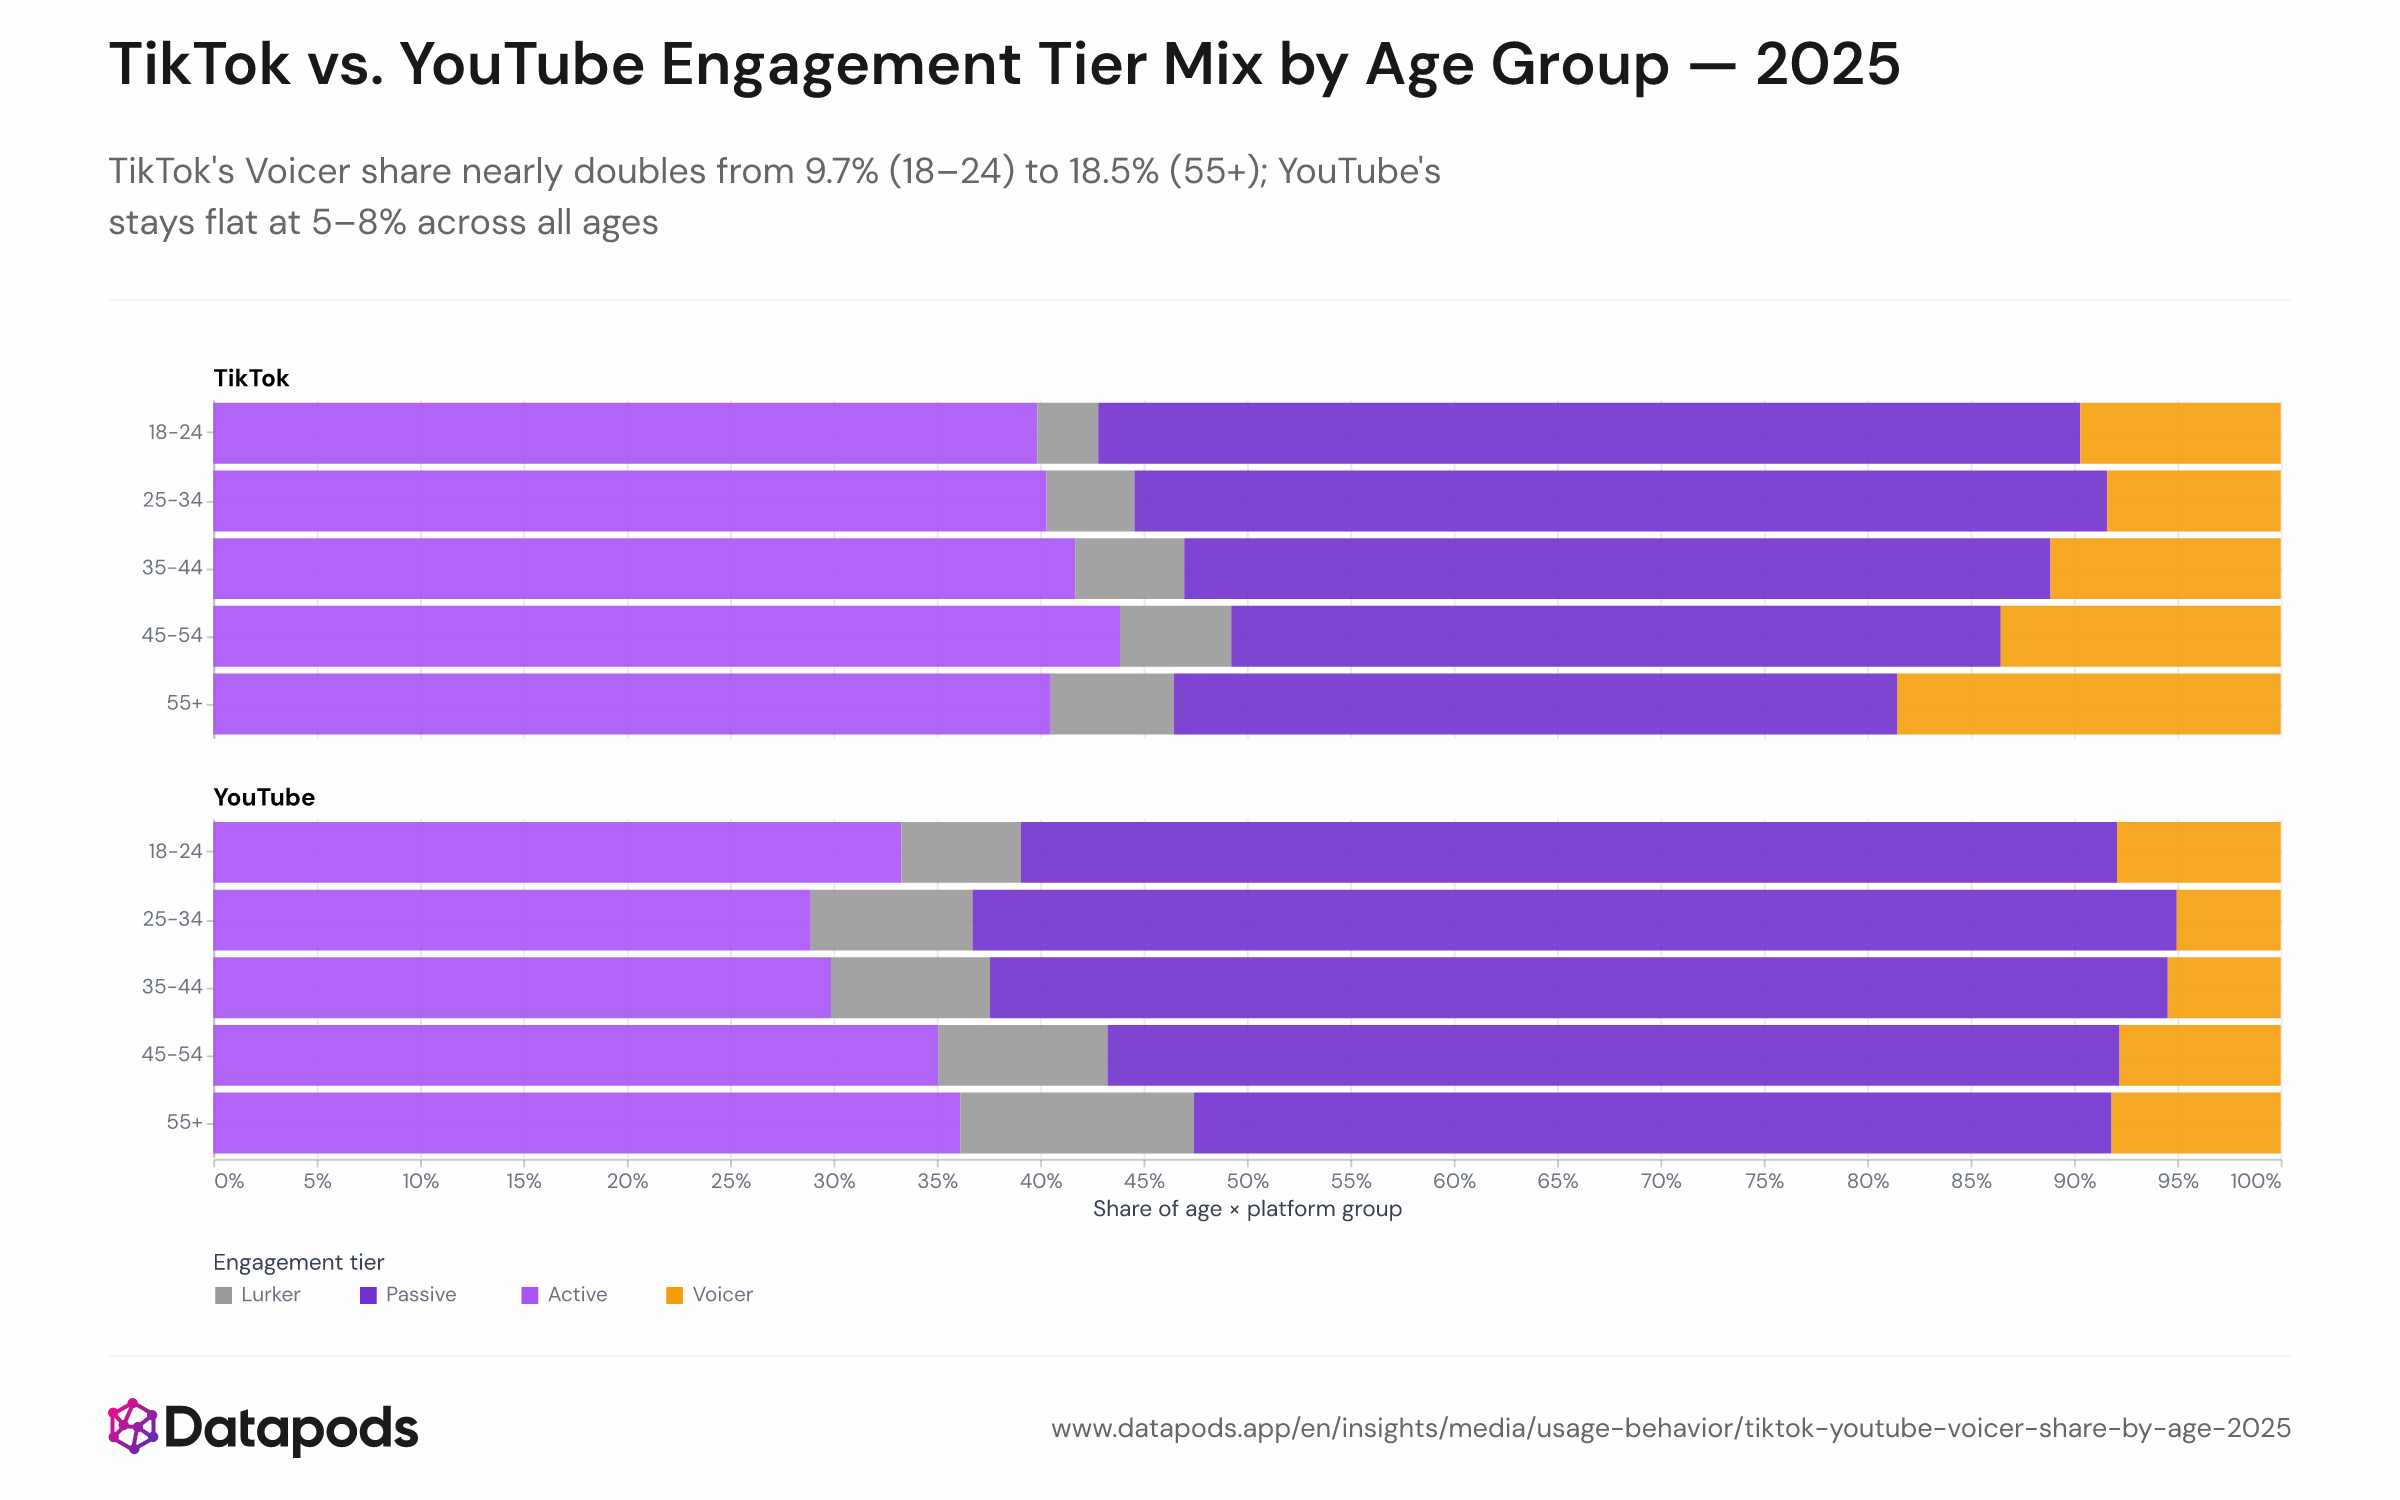
TikTok vs. YouTube Engagement Tier Mix by Age Group — 2025Stacked bar chart showing the share of users in each engagement tier (Lurker, Passive, Active, Voicer) broken down by age group (18–24, 25–34, 35–44, 45–54, 55+) and platform (TikTok and YouTube) for 2025. Each bar represents 100% of users in that age-platform combination, with tier segments stacked to show composition.Stacked bar chart showing the share of users in each engagement tier (Lurker, Passive, Active, Voicer) broken down by age group (18–24, 25–34, 35–44, 45–54, 55+) and platform (TikTok and YouTube) for 2025. Each bar represents 100% of users in that age-platform combination, with tier segments stacked to show composition.
Stacked bar chart showing the share of users in each engagement tier (Lurker, Passive, Active, Voicer) broken down by age group (18–24, 25–34, 35–44, 45–54, 55+) and platform (TikTok and YouTube) for 2025. Each bar represents 100% of users in that age-platform combination, with tier segments stacked to show composition.
Sample size
n = 30,296
Data date
Full Year 2025
Segment
All segments
Platform
TikTok, YouTube
Market
Germany
Info
Sample size
n = 30,296
Data date
Full Year 2025
Segment
All segments
Platform
TikTok, YouTube
Market
Germany

Analysis

On TikTok, the share of users who comment and engage publicly rises with every age band, reaching 18.5% among the 55+ group — nearly twice the 9.7% rate among 18–24-year-olds. YouTube shows no such gradient; its Voicer share hovers between 5% and 8% regardless of age, while its Lurker share actually climbs from 5.8% among younger users to 11.3% among those 55 and older.

Older TikTok users arrive ready to participate — not just watch

TikTok's older audience has grown dramatically in recent years: adoption among users 45 and older surged from 2% in 2019 to 26% by 2025. This was not a passive migration — research suggests older users increasingly seek out value-driven, community-oriented content and are more likely to respond to it. The For You Page also removes the follower-count barrier that can discourage first-time commenters on creator-centric platforms, making it easier for any user to feel their voice reaches an audience. On YouTube, older users face a different dynamic: they skew toward intentional, search-driven viewing where the norm is to watch and move on, which explains the rising Lurker share with age. For marketers, this upends the assumption that older cohorts are purely passive audiences — on TikTok, the 55+ group is proportionally the most vocal segment of all. For the within-user view of these platform differences, see the dual-platform voice ratio comparison.


This analysis is based on public segment data. For deeper cuts, use our Enterprise interface.

Related statistics

See all Usage Behavior
  • Spotify vs. Amazon Music: Reach by Age Group

    Q1 2026
  • Spotify Users Open the App 2.5× More Than Amazon Music

    Q1 2026
  • GfK Consumer Confidence vs. Digital Frugality Signals in Germany — Scatter Plot, Jan 2025–Apr 2026

    Jan 2025–Apr 2026
  • Unlock deeper cuts

    Enterprise
See all Usage Behavior

Methodology

The analysis covers 30,296 users active on either TikTok or YouTube during 2025 (at least 50 interactions on the respective platform). Each user was assigned to an engagement tier based on their voice ratio — the share of public actions in their total activity: Lurker (0%), Passive (above 0% to 2%), Active (2–20%), or Voicer (above 20%, with at least 200 interactions). Age was calculated from birth year and grouped into five bands (18–24, 25–34, 35–44, 45–54, 55+). Users without a recorded birth year and those under 18 were excluded. Each age-platform cell contains at least 110 users. The chart shows the tier composition within each age band separately for TikTok and YouTube.


These insights are based on the Datapods Panel. Our data comes exclusively from users who are compensated for their anonymity. Become part of the panel & earn from your data