Datapods|Insights
Consumption
Online ShoppingProduct CategoriesRetailSocial Commerce
Digital
Web & BrowsingSearch QueriesApps & MobileAdvertising
Media
Video & StreamingSocial MediaTrends & TopicsUsage Behavior
Blog|For BusinessFor Consumers
Datapods|Insights
ConsumptionOnline ShoppingProduct CategoriesRetailSocial CommerceDigitalWeb & BrowsingSearch QueriesApps & MobileAdvertisingMediaVideo & StreamingSocial MediaTrends & TopicsUsage BehaviorBlogFor BusinessFor Consumers
InsightsMediaUsage Behavior
Datapods

Talk to people who actually bought your product.

Use Cases

  • Churn & Win-Back
  • Product & Concept Testing
  • Ad & Creative Testing
  • Customer Journey
  • Competitive Intelligence
  • Audiences & Segmentation
  • Influencers & Creators

Industries

  • Grocery & Drugstore
  • CPG & Brands
  • E-Commerce & Marketplaces
  • Telco & Subscriptions
  • Media & Streaming
  • Apps & Digital

Platform

  • AI Research Agent
  • AI Interviewer
  • Quant Surveys
  • Audience Builder
  • Data API
  • Social Attribution

Company

  • Home
  • About
  • For Consumers
  • The Datapods Panel
  • Insights
  • Contact
  • Blog

Legal

  • Imprint
  • Privacy Policy
  • User Agreement App
  • Privacy Policy App
  • User Agreement Platform
  • Privacy Policy Platform
  • Cookie Policy

©2026 Datapods.app. All rights reserved.

EU Co-financedNRW

GfK Consumer Confidence vs. Digital Frugality Signals in Germany — Scatter Plot, Jan 2025–Apr 2026

Results as of 13.05.2026

Review Jan 2025–Apr 2026: Discount-term Google search share is the only statistically significant digital-frugality signal correlated with German consumer confidence (r = –0.53) — price-comparison reach and finance YouTube viewing are not
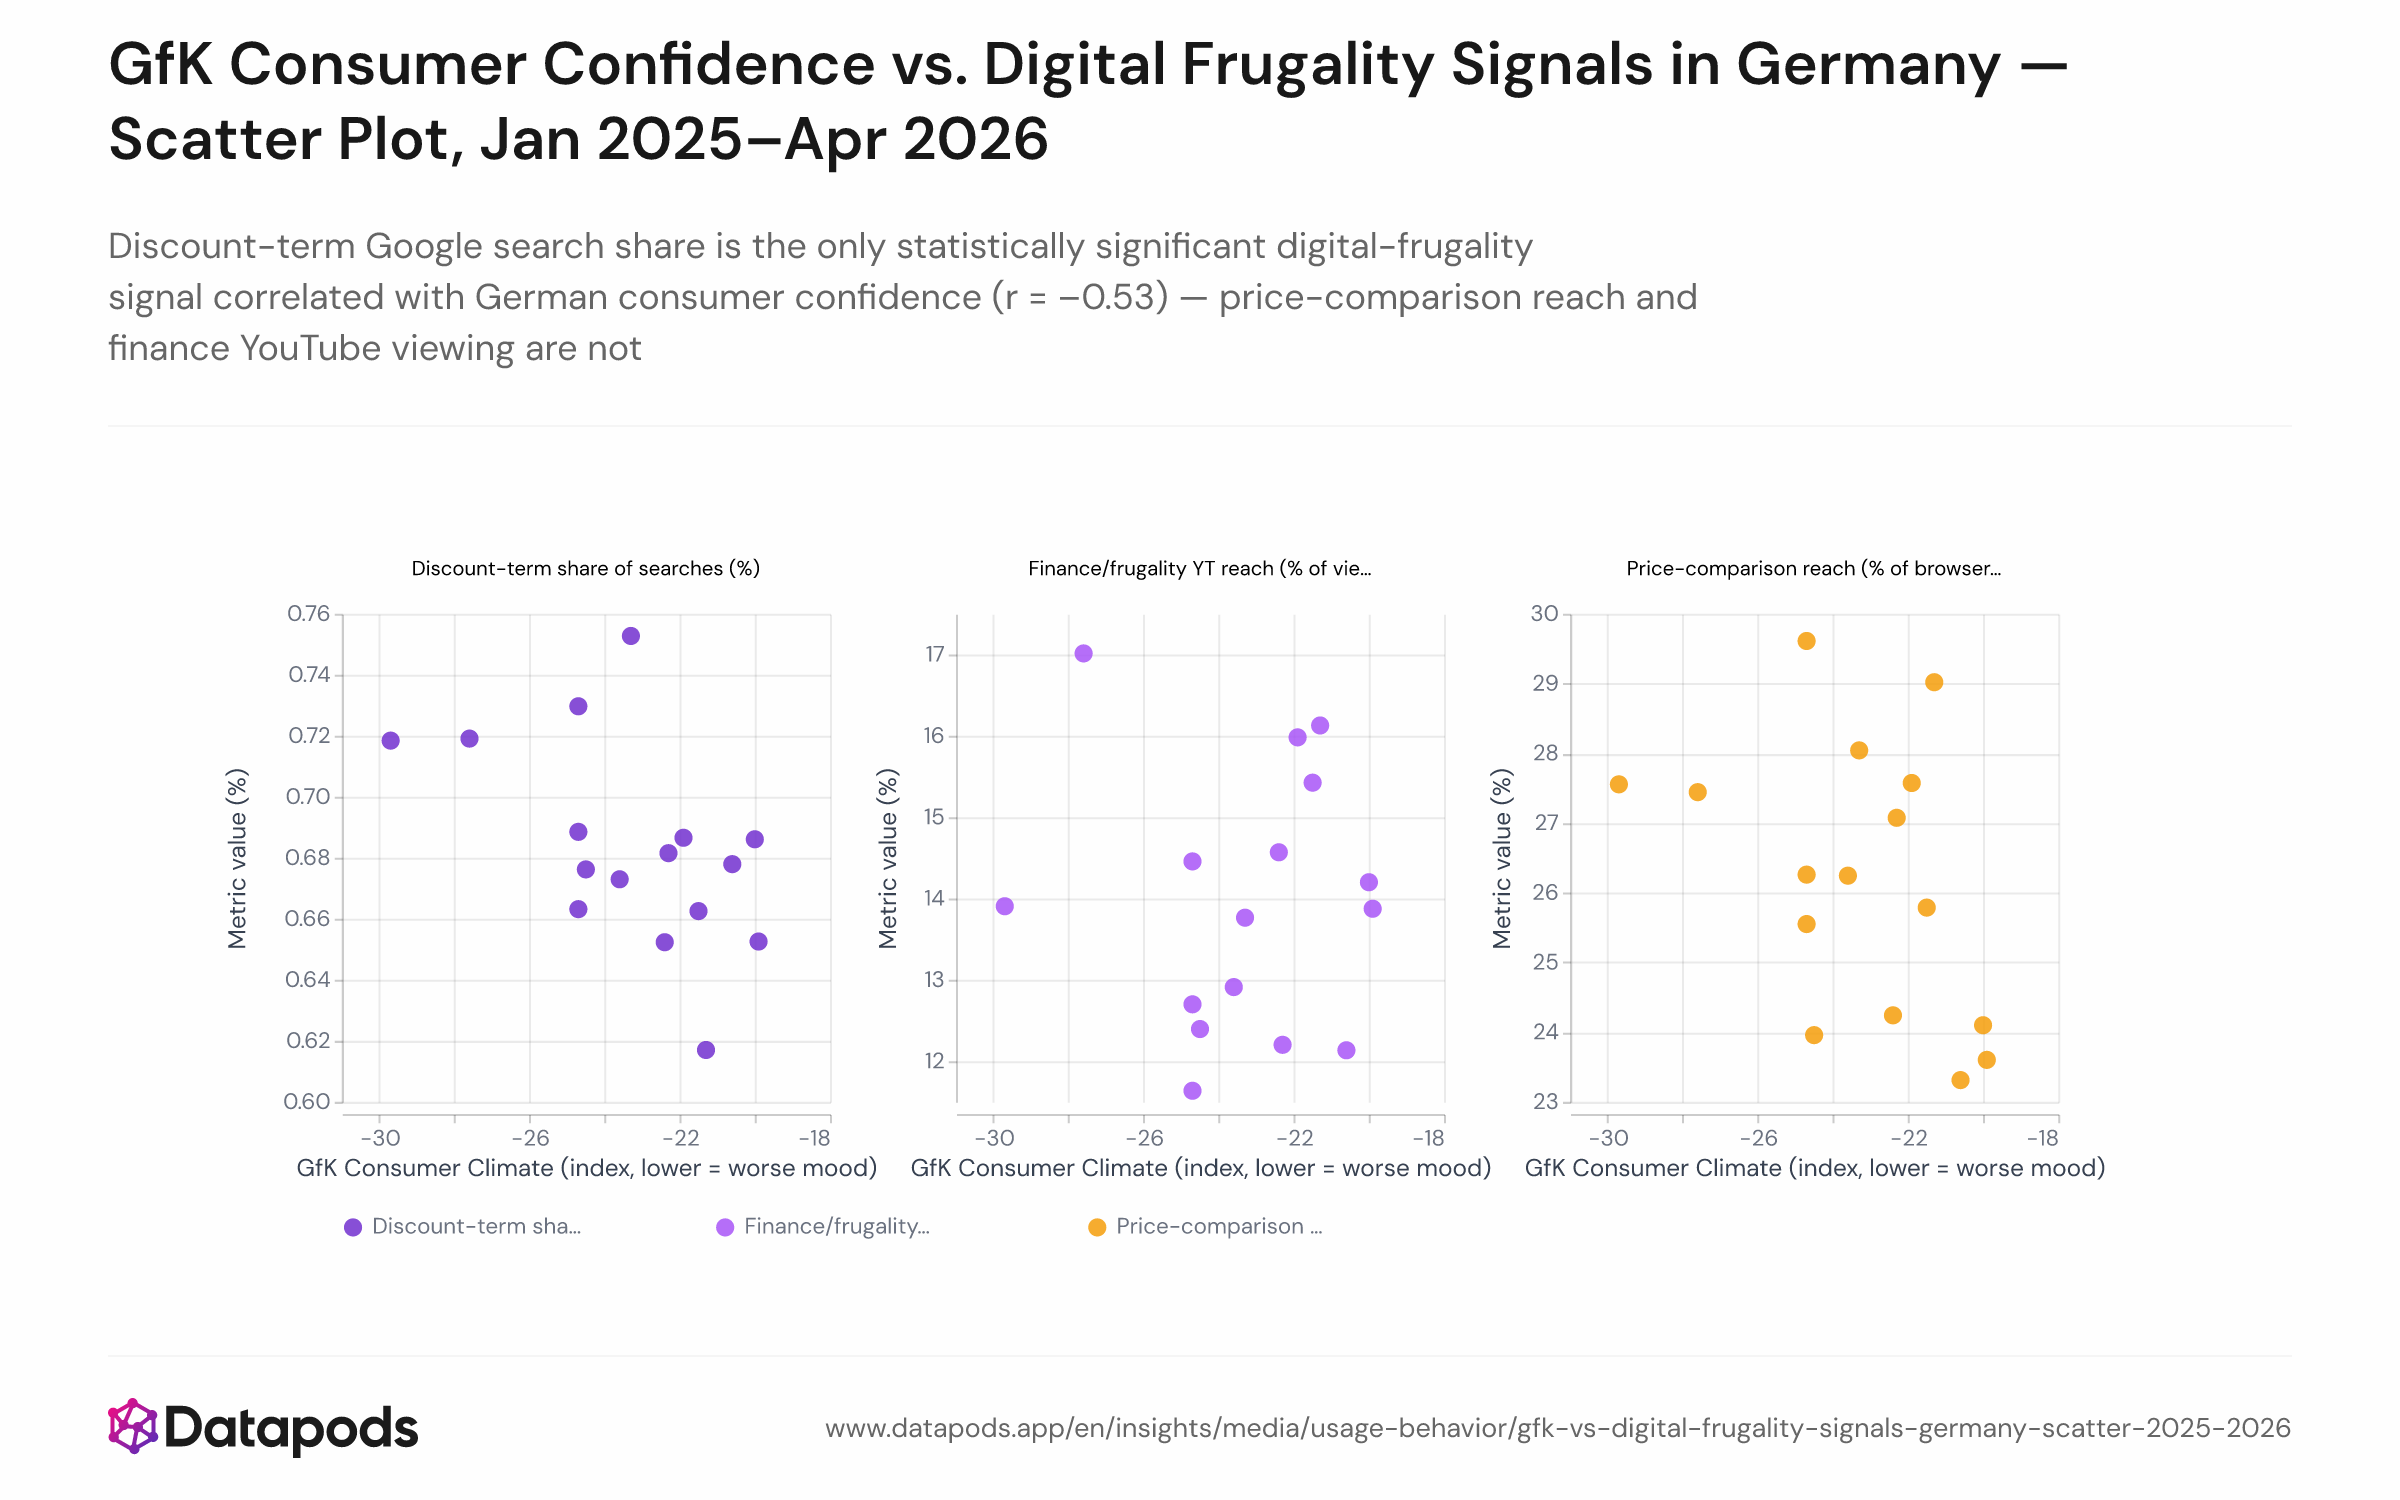
GfK Consumer Confidence vs. Digital Frugality Signals in Germany — Scatter Plot, Jan 2025–Apr 2026Scatter plot with three series, each showing 16 monthly observations from January 2025 to April 2026. The x-axis is the GfK/NIM Consumer Climate index (range approximately –18 to –30). The y-axis shows three digital-frugality metrics plotted together or in panels: price-comparison site reach (%), discount-term share of Google searches (%), and personal-finance YouTube channel reach (%). Each series includes a linear regression line.Scatter plot with three series, each showing 16 monthly observations from January 2025 to April 2026. The x-axis is the GfK/NIM Consumer Climate index (range approximately –18 to –30). The y-axis shows three digital-frugality metrics plotted together or in panels: price-comparison site reach (%), discount-term share of Google searches (%), and personal-finance YouTube channel reach (%). Each series includes a linear regression line.
Scatter plot with three series, each showing 16 monthly observations from January 2025 to April 2026. The x-axis is the GfK/NIM Consumer Climate index (range approximately –18 to –30). The y-axis shows three digital-frugality metrics plotted together or in panels: price-comparison site reach (%), discount-term share of Google searches (%), and personal-finance YouTube channel reach (%). Each series includes a linear regression line.
Sample size
n = 4,252
Data date
Jan 2025–Apr 2026
Segment
All segments
Platform
Browsing, Search, YouTube
Market
Germany
Info
Sample size
n = 4,252
Data date
Jan 2025–Apr 2026
Segment
All segments
Platform
Browsing, Search, YouTube
Market
Germany

Analysis

Plotting 16 monthly observations against the GfK/NIM Consumer Climate index reveals a clear hierarchy among three digital-frugality signals: the discount-term share of German Google searches carries the strongest negative relationship (r = –0.53), price-comparison site reach shows a moderate directional link (r = –0.42), and personal-finance YouTube reach shows none (r = –0.03).

Search intent reveals pressure faster than browsing or viewing

The finding makes intuitive sense: typing 'lieferando gutschein' or 'temu gutscheincode' into a search bar is an immediate, transactional behaviour that responds quickly to budget pressure — it requires active intent. Visiting a price-comparison site is a step further removed, and watching a finance channel is driven largely by content supply and algorithm recommendations rather than by household stress. Germany's consumer mood deteriorated persistently through this window, with the GfK/NIM index declining from around –20 in mid-2025 to –28 in April 2026, and the propensity to save reaching its highest level since the 2008 financial crisis at the end of 2025. In that environment, the search layer proved the most sensitive real-time indicator of how digital behaviour in Germany responds to economic pressure.


This analysis is based on public segment data. For deeper cuts, use our Enterprise interface.

Related statistics

See all Usage Behavior
  • Public Action Concentration Among Voicers on TikTok and YouTube in Germany — 2025

    Full Year 2025
  • TikTok vs. YouTube Engagement Tier Mix by Age Group — 2025

    Full Year 2025
  • Unlock deeper cuts

    Enterprise
  • Heavy-Voicer Share by Age Group on TikTok and YouTube in Germany — 2025

    Full Year 2025
See all Usage Behavior

Methodology

Each of the 16 data points represents one calendar month from January 2025 to April 2026. The x-axis is the GfK/NIM Consumer Climate index for that month, taken from official NIM press releases. The y-axis shows one of three digital-frugality metrics: (1) share of active browsers visiting price-comparison domains, (2) discount-term share of all Google searches, or (3) share of YouTube-active users watching personal-finance channels. Pearson correlation coefficients are computed across all 16 monthly pairs for each signal independently. The three signal series are described in full in their respective trend charts.


These insights are based on the Datapods Panel. Our data comes exclusively from users who are compensated for their anonymity. Become part of the panel & earn from your data