Datapods|Insights
Consumption
Online ShoppingProduct CategoriesRetailSocial Commerce
Digital
Web & BrowsingSearch QueriesApps & MobileAdvertising
Media
Video & StreamingSocial MediaTrends & TopicsUsage Behavior
Blog|For BusinessFor Consumers
Datapods|Insights
ConsumptionOnline ShoppingProduct CategoriesRetailSocial CommerceDigitalWeb & BrowsingSearch QueriesApps & MobileAdvertisingMediaVideo & StreamingSocial MediaTrends & TopicsUsage BehaviorBlogFor BusinessFor Consumers
InsightsMediaUsage Behavior
Datapods

Talk to people who actually bought your product.

Use Cases

  • Churn & Win-Back
  • Product & Concept Testing
  • Ad & Creative Testing
  • Customer Journey
  • Competitive Intelligence
  • Audiences & Segmentation
  • Influencers & Creators

Industries

  • Grocery & Drugstore
  • CPG & Brands
  • E-Commerce & Marketplaces
  • Telco & Subscriptions
  • Media & Streaming
  • Apps & Digital

Platform

  • AI Research Agent
  • AI Interviewer
  • Quant Surveys
  • Audience Builder
  • Data API
  • Social Attribution

Company

  • Home
  • About
  • For Consumers
  • The Datapods Panel
  • Insights
  • Contact
  • Blog

Legal

  • Imprint
  • Privacy Policy
  • User Agreement App
  • Privacy Policy App
  • User Agreement Platform
  • Privacy Policy Platform
  • Cookie Policy

©2026 Datapods.app. All rights reserved.

EU Co-financedNRW

Amazon DE Order Placement by Day of Week and Category — Germany 2025

Results as of 07.05.2026

Review Full Year 2025: Tuesday is the peak order day on Amazon.de across every major category — Saturday is the trough, with Food & Beverages orders down -23% below the daily average
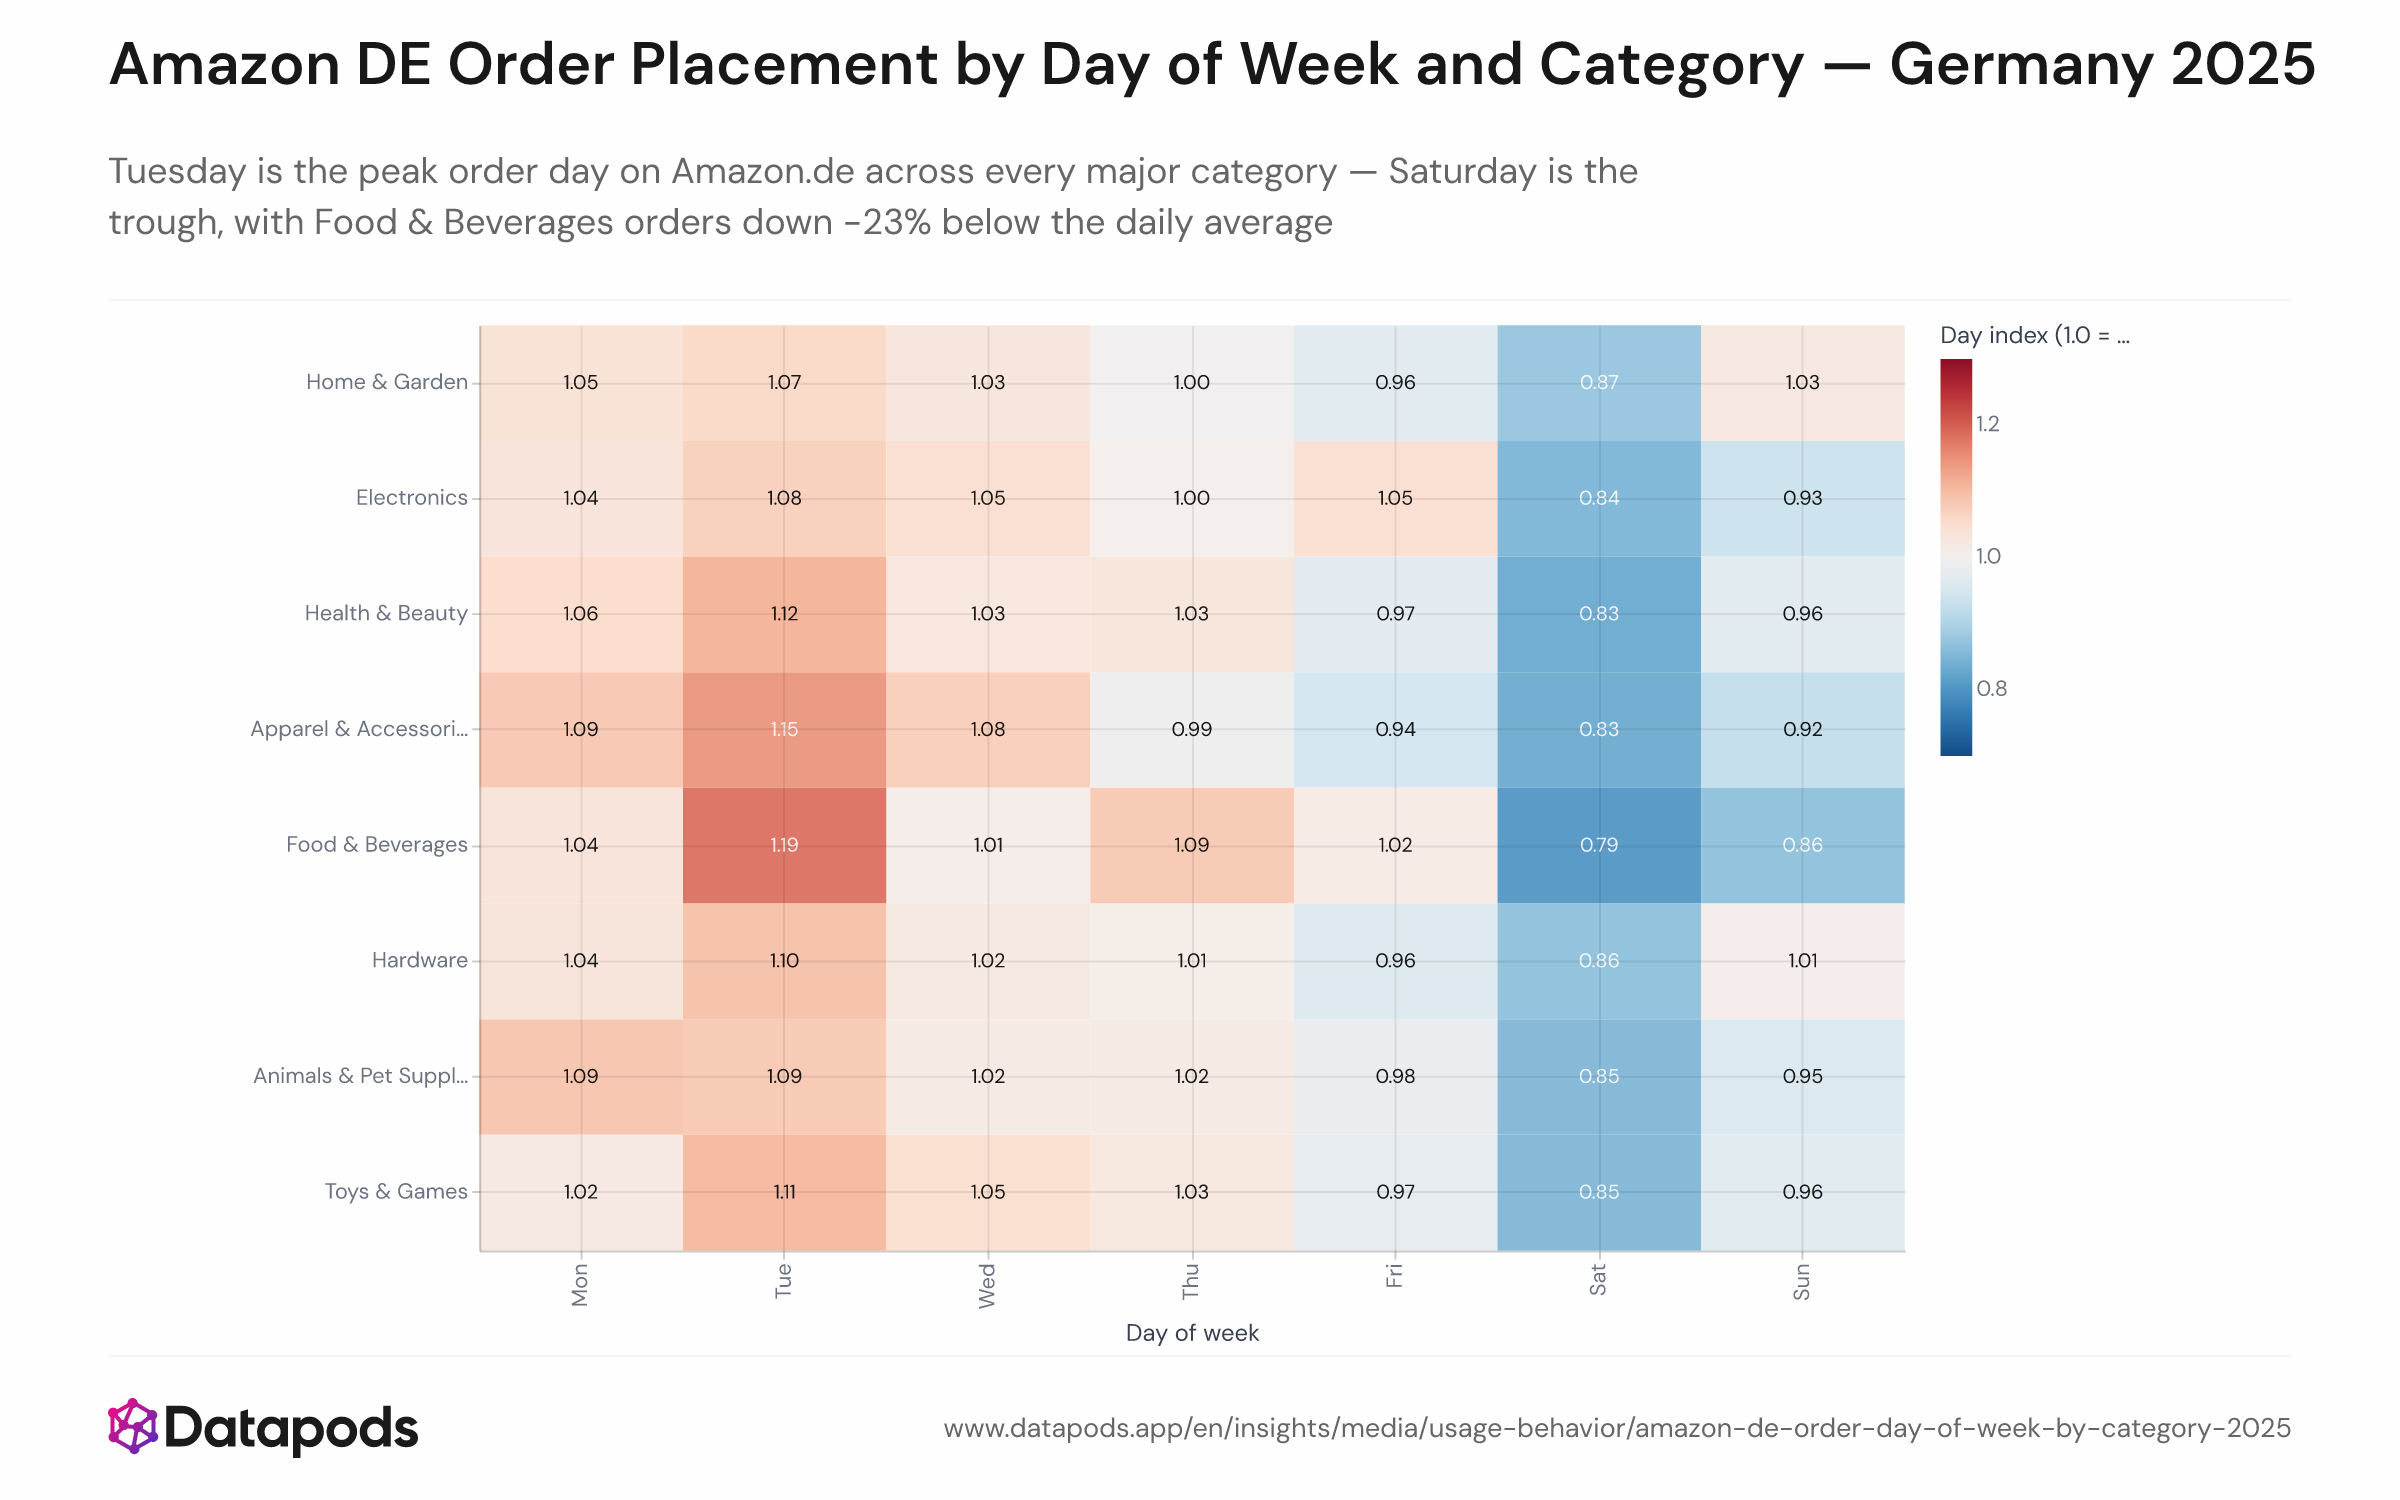
Amazon DE Order Placement by Day of Week and Category — Germany 2025Indexed heat map or multi-line chart showing Amazon.de daily order volume by day of week for each major product category in 2025. The index is set to 1.0 for each category's average day. Tuesday shows the highest index across all categories; Saturday shows the lowest. Food & Beverages has the steepest weekend dip at -23%; Home & Garden is the flattest at -7%.Indexed heat map or multi-line chart showing Amazon.de daily order volume by day of week for each major product category in 2025. The index is set to 1.0 for each category's average day. Tuesday shows the highest index across all categories; Saturday shows the lowest. Food & Beverages has the steepest weekend dip at -23%; Home & Garden is the flattest at -7%.
Indexed heat map or multi-line chart showing Amazon.de daily order volume by day of week for each major product category in 2025. The index is set to 1.0 for each category's average day. Tuesday shows the highest index across all categories; Saturday shows the lowest. Food & Beverages has the steepest weekend dip at -23%; Home & Garden is the flattest at -7%.
Sample size
n = 5,171
Data date
Full Year 2025
Segment
All segments
Platform
Purchases
Market
Germany
Info
Sample size
n = 5,171
Data date
Full Year 2025
Segment
All segments
Platform
Purchases
Market
Germany

Analysis

Amazon Germany's weekday shopping rhythm is not a niche effect — it holds across every major product category in 2025, with Tuesday consistently delivering the highest order volume and Saturday the lowest. The weekend dip ranges from -7% in Home & Garden to a striking -23% in Food & Beverages, revealing that replenishment and planned purchases are overwhelmingly a workweek ritual for German shoppers.

Why the workweek drives the buy moment

Broadly, German online shoppers tend to place orders during or just after working hours on weekdays — a pattern observed across European markets, where evenings from 7 p.m. onward are the dominant purchase window and Saturday is a consistent soft spot. The weekday skew is sharpest in utilitarian categories (Food & Beverages, Apparel) where orders are deliberate and planned, and flattest in Home & Garden, a category driven by project-triggered purchases that are less tightly coupled to the weekly work rhythm. The implication for sellers and advertisers is direct: bid strategies and promotional pushes timed to Tuesday–Thursday will capture the lion's share of German purchase intent. See how this pattern varies by buyer age in the Amazon weekday skew by age group chart.


This analysis is based on public segment data. For deeper cuts, use our Enterprise interface.

Related statistics

See all Usage Behavior
  • GfK Consumer Confidence vs. Digital Frugality Signals in Germany — Scatter Plot, Jan 2025–Apr 2026

    Jan 2025–Apr 2026
  • Public Action Concentration Among Voicers on TikTok and YouTube in Germany — 2025

    Full Year 2025
  • TikTok vs. YouTube Engagement Tier Mix by Age Group — 2025

    Full Year 2025
  • Unlock deeper cuts

    Enterprise
See all Usage Behavior

Methodology

Order placement data covers German Amazon shoppers throughout the full calendar year 2025. Each day of the week is indexed against that category's average daily order rate, so a value of 1.0 equals an average day, above 1.0 means more orders than average, and below 1.0 means fewer. Only product categories with substantial annual order volume are included. The metric captures when buyers click 'order', not when parcels are delivered.


These insights are based on the Datapods Panel. Our data comes exclusively from users who are compensated for their anonymity. Become part of the panel & earn from your data