Datapods|Insights
Consumption
Online ShoppingProduct CategoriesRetailSocial Commerce
Digital
Web & BrowsingSearch QueriesApps & MobileAdvertising
Media
Video & StreamingSocial MediaTrends & TopicsUsage Behavior
Blog|For BusinessFor Consumers
Datapods|Insights
ConsumptionOnline ShoppingProduct CategoriesRetailSocial CommerceDigitalWeb & BrowsingSearch QueriesApps & MobileAdvertisingMediaVideo & StreamingSocial MediaTrends & TopicsUsage BehaviorBlogFor BusinessFor Consumers
InsightsMediaTrends & Topics
Datapods

Talk to people who actually bought your product.

Use Cases

  • Churn & Win-Back
  • Product & Concept Testing
  • Ad & Creative Testing
  • Customer Journey
  • Competitive Intelligence
  • Audiences & Segmentation
  • Influencers & Creators

Industries

  • Grocery & Drugstore
  • CPG & Brands
  • E-Commerce & Marketplaces
  • Telco & Subscriptions
  • Media & Streaming
  • Apps & Digital

Platform

  • AI Research Agent
  • AI Interviewer
  • Quant Surveys
  • Audience Builder
  • Data API
  • Social Attribution

Company

  • Home
  • About
  • For Consumers
  • The Datapods Panel
  • Insights
  • Contact
  • Blog

Legal

  • Imprint
  • Privacy Policy
  • User Agreement App
  • Privacy Policy App
  • User Agreement Platform
  • Privacy Policy Platform
  • Cookie Policy

©2026 Datapods.app. All rights reserved.

EU Co-financedNRW

Taylor Swift median watch time per viewer – Q1 2024 vs Q1 2025 by age

Results as of 28.04.2026

Review Q1 2024 vs Q1 2025: Even active Taylor Swift viewers cut watch time ~20% in Q1 2025 -19% among 16–24s
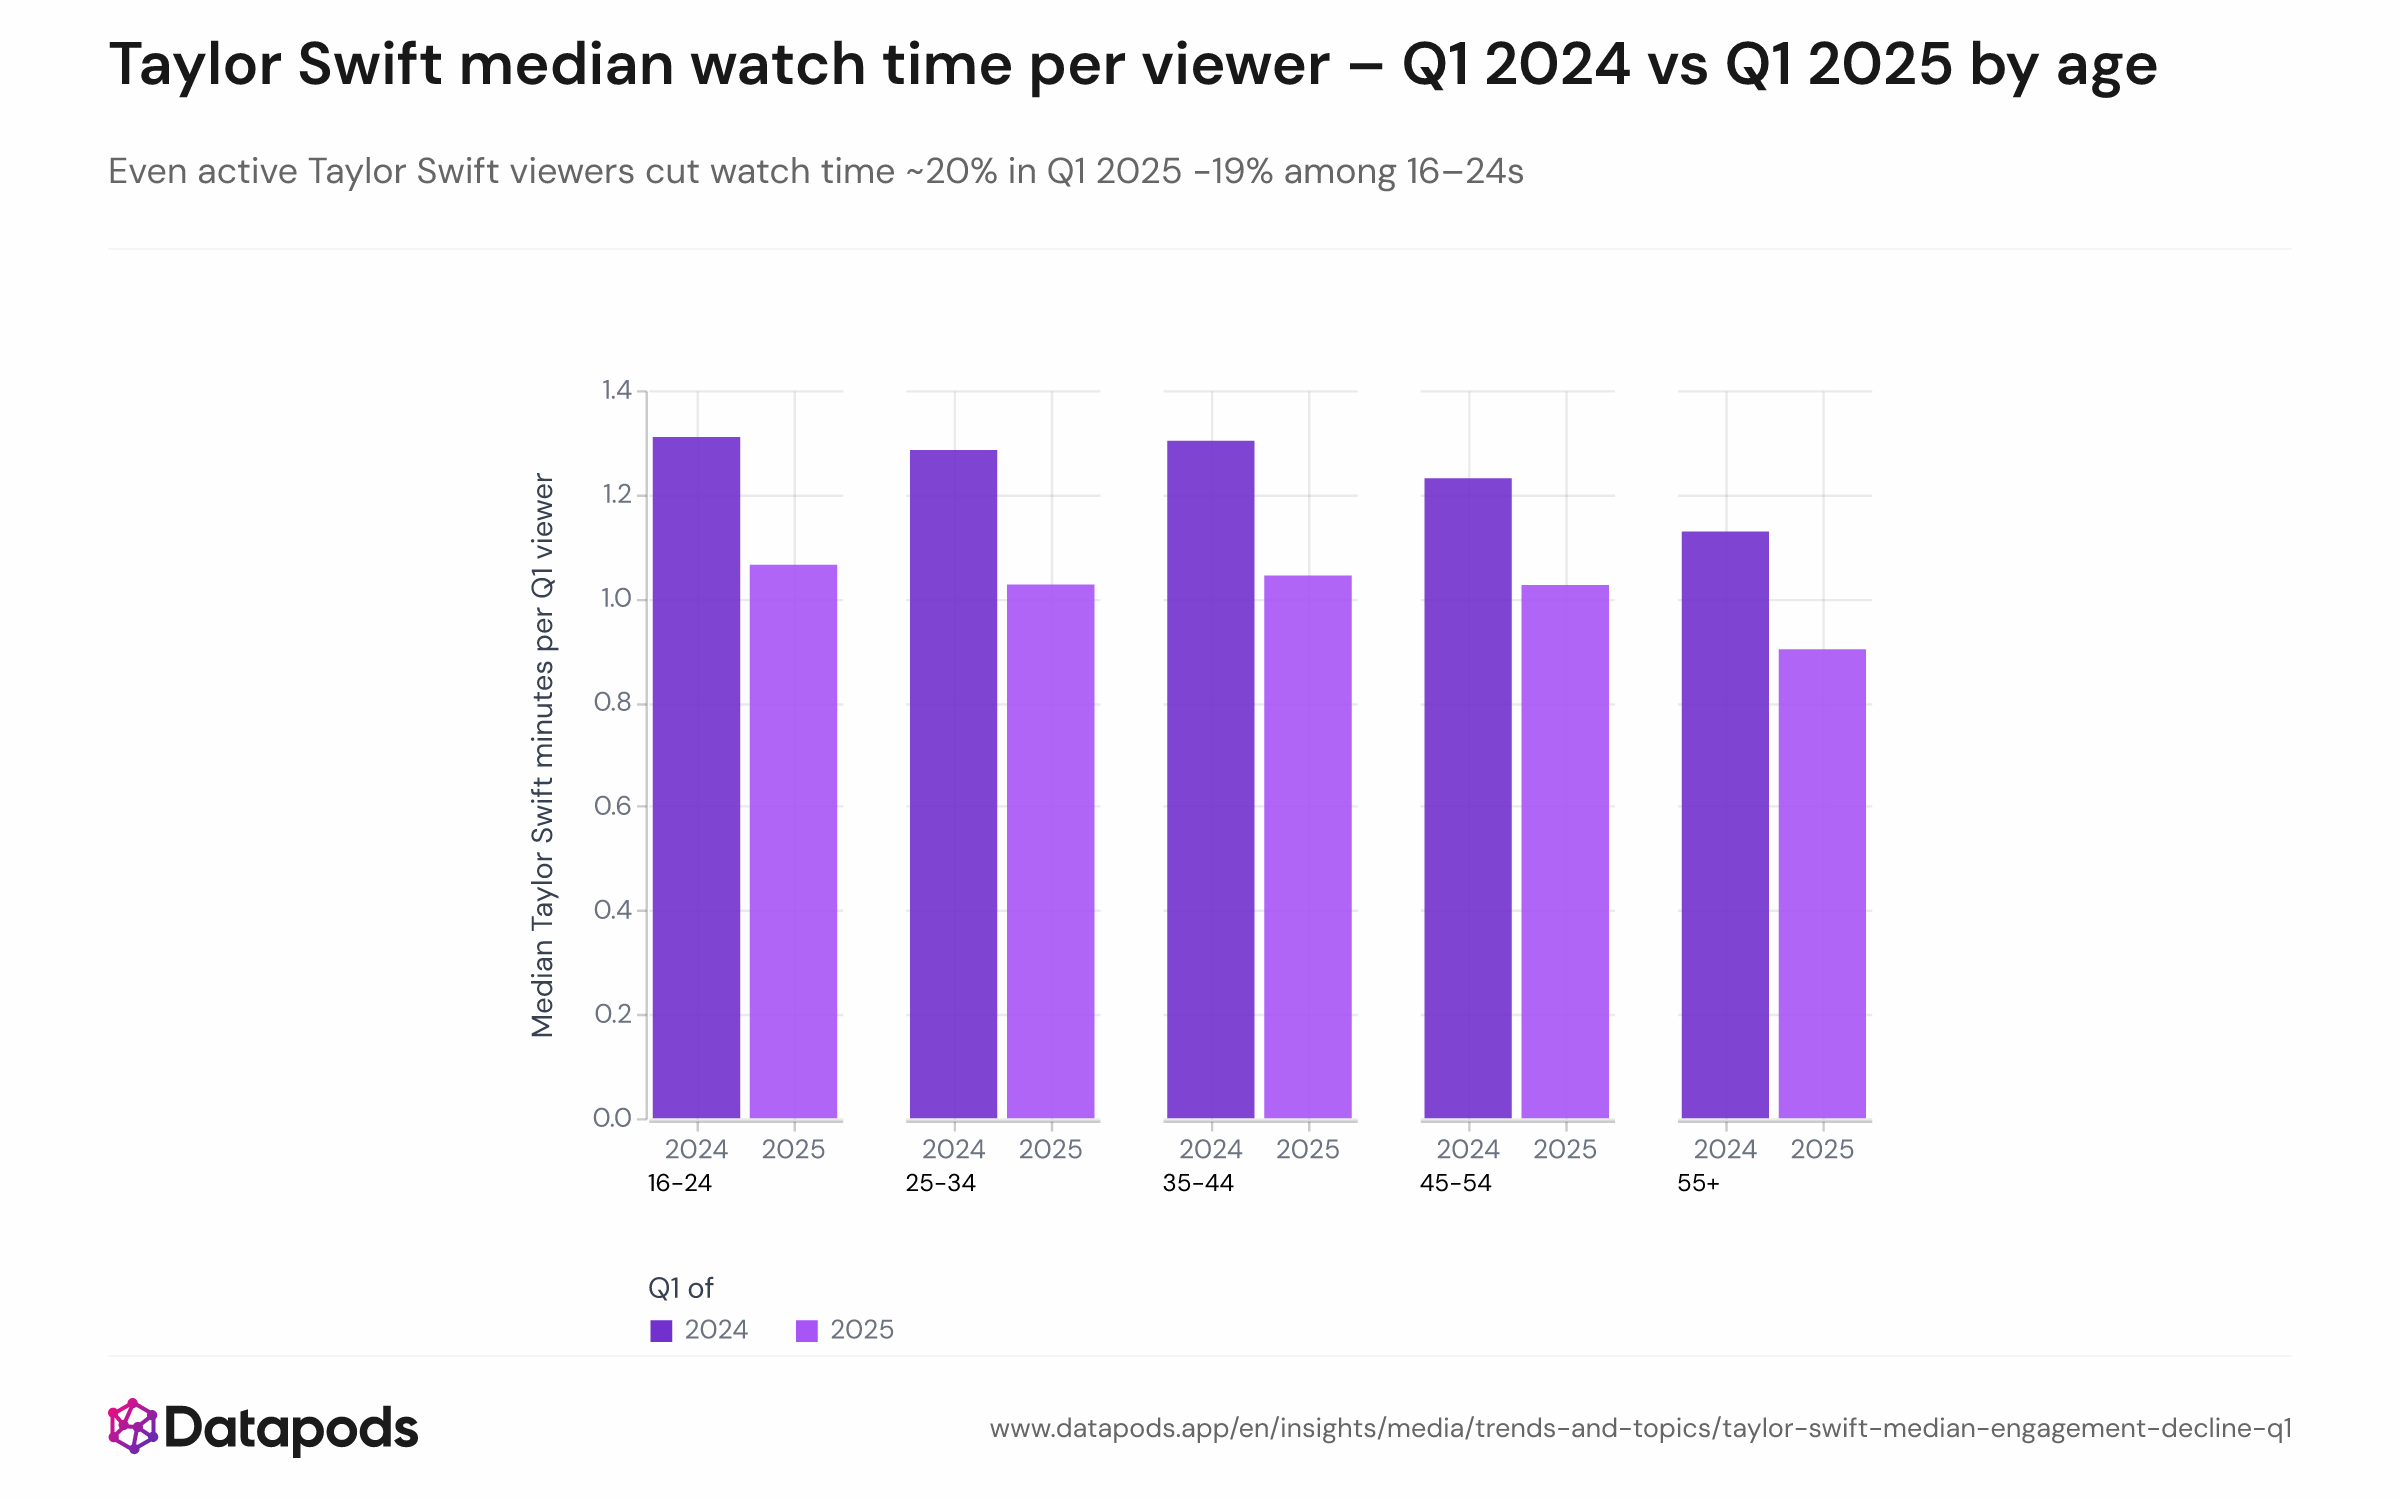
Taylor Swift median watch time per viewer – Q1 2024 vs Q1 2025 by ageGrouped bar chart showing median quarterly watch time per active Taylor Swift viewer across age groups 16–24, 25–34, 35–44, 45–54, and 55+ comparing Q1 2024 to Q1 2025, with declines of 15–22% across most cohorts.Grouped bar chart showing median quarterly watch time per active Taylor Swift viewer across age groups 16–24, 25–34, 35–44, 45–54, and 55+ comparing Q1 2024 to Q1 2025, with declines of 15–22% across most cohorts.
Grouped bar chart showing median quarterly watch time per active Taylor Swift viewer across age groups 16–24, 25–34, 35–44, 45–54, and 55+ comparing Q1 2024 to Q1 2025, with declines of 15–22% across most cohorts.
Sample size
n = 5,631
Data date
Q1 2024 vs Q1 2025
Segment
All segments
Platform
YouTube
Market
Germany
Info
Sample size
n = 5,631
Data date
Q1 2024 vs Q1 2025
Segment
All segments
Platform
YouTube
Market
Germany

Analysis

Among Germans who actively watched Taylor Swift content in the first quarter, median engagement softened year-over-year across nearly all cohorts. The 16–24 group dropped from 1.31 to 1.06 minutes (−19%), while 35–44 year-olds fell from 1.30 to 1.04 minutes (−20%). The contraction affected not just the size of the audience but also the depth of engagement: typical fans spent measurably less time per quarter in 2025.


This analysis is based on public segment data. For deeper cuts, use our Enterprise interface.

Related statistics

See all Trends & Topics
  • Eurovision 2026 YouTube Watch-Time by Age Group in Germany — May 2026

    16–17 May 2026
  • Unlock deeper cuts

    Enterprise
  • Eurovision 2026 Attention Index Across Platforms in Germany — April–May 2026

    16–17 May 2026
  • Eurovision 2026 Google Search Share in Germany — April–May 2026

    16 May 2026
See all Trends & Topics

Methodology

Taylor Swift viewer = panelist with at least one tracked watch event on Taylor Swift content during January–March. Per-user quarterly watch time is summed, then the median is calculated separately for each age cohort. Sample sizes range from 90 to 1,041 viewers per cell, well above the minimum threshold. Watch time is inferred from session timing and capped at 4 hours.


These insights are based on the Datapods Panel. Our data comes exclusively from users who are compensated for their anonymity. Become part of the panel & earn from your data