Datapods|Insights
Consumption
Online ShoppingProduct CategoriesRetailSocial Commerce
Digital
Web & BrowsingSearch QueriesApps & MobileAdvertising
Media
Video & StreamingSocial MediaTrends & TopicsUsage Behavior
Resources|For BusinessFor Consumers
Datapods|Insights
ConsumptionOnline ShoppingProduct CategoriesRetailSocial CommerceDigitalWeb & BrowsingSearch QueriesApps & MobileAdvertisingMediaVideo & StreamingSocial MediaTrends & TopicsUsage BehaviorResourcesFor BusinessFor Consumers
InsightsMediaSocial Media
Datapods

Talk to people who actually bought your product.

Use Cases

  • Churn & Win-Back
  • Product & Concept Testing
  • Ad & Creative Testing
  • Customer Journey
  • Competitive Intelligence
  • Audiences & Segmentation
  • Influencers & Creators

Industries

  • Grocery & Drugstore
  • CPG & Brands
  • E-Commerce & Marketplaces
  • Telco & Subscriptions
  • Media & Streaming
  • Apps & Digital

Platform

  • AI Research Agent
  • AI Interviewer
  • Quant Surveys
  • Audience Builder
  • Data API
  • Social Attribution

Company

  • Home
  • About
  • For Consumers
  • The Datapods Panel
  • Insights
  • Contact
  • Resources

Legal

  • Imprint
  • Privacy Policy
  • User Agreement App
  • Privacy Policy App
  • User Agreement Platform
  • Privacy Policy Platform
  • Cookie Policy

©2026 Datapods.app. All rights reserved.

EU Co-financedNRW

TikTok Weekly Median Watch Trend by Age in Germany — Q1 2025

Results as of 28.04.2026

Review Q1 2025: 16–24s lead every week of Q1 — age gap holds steady as panel grows
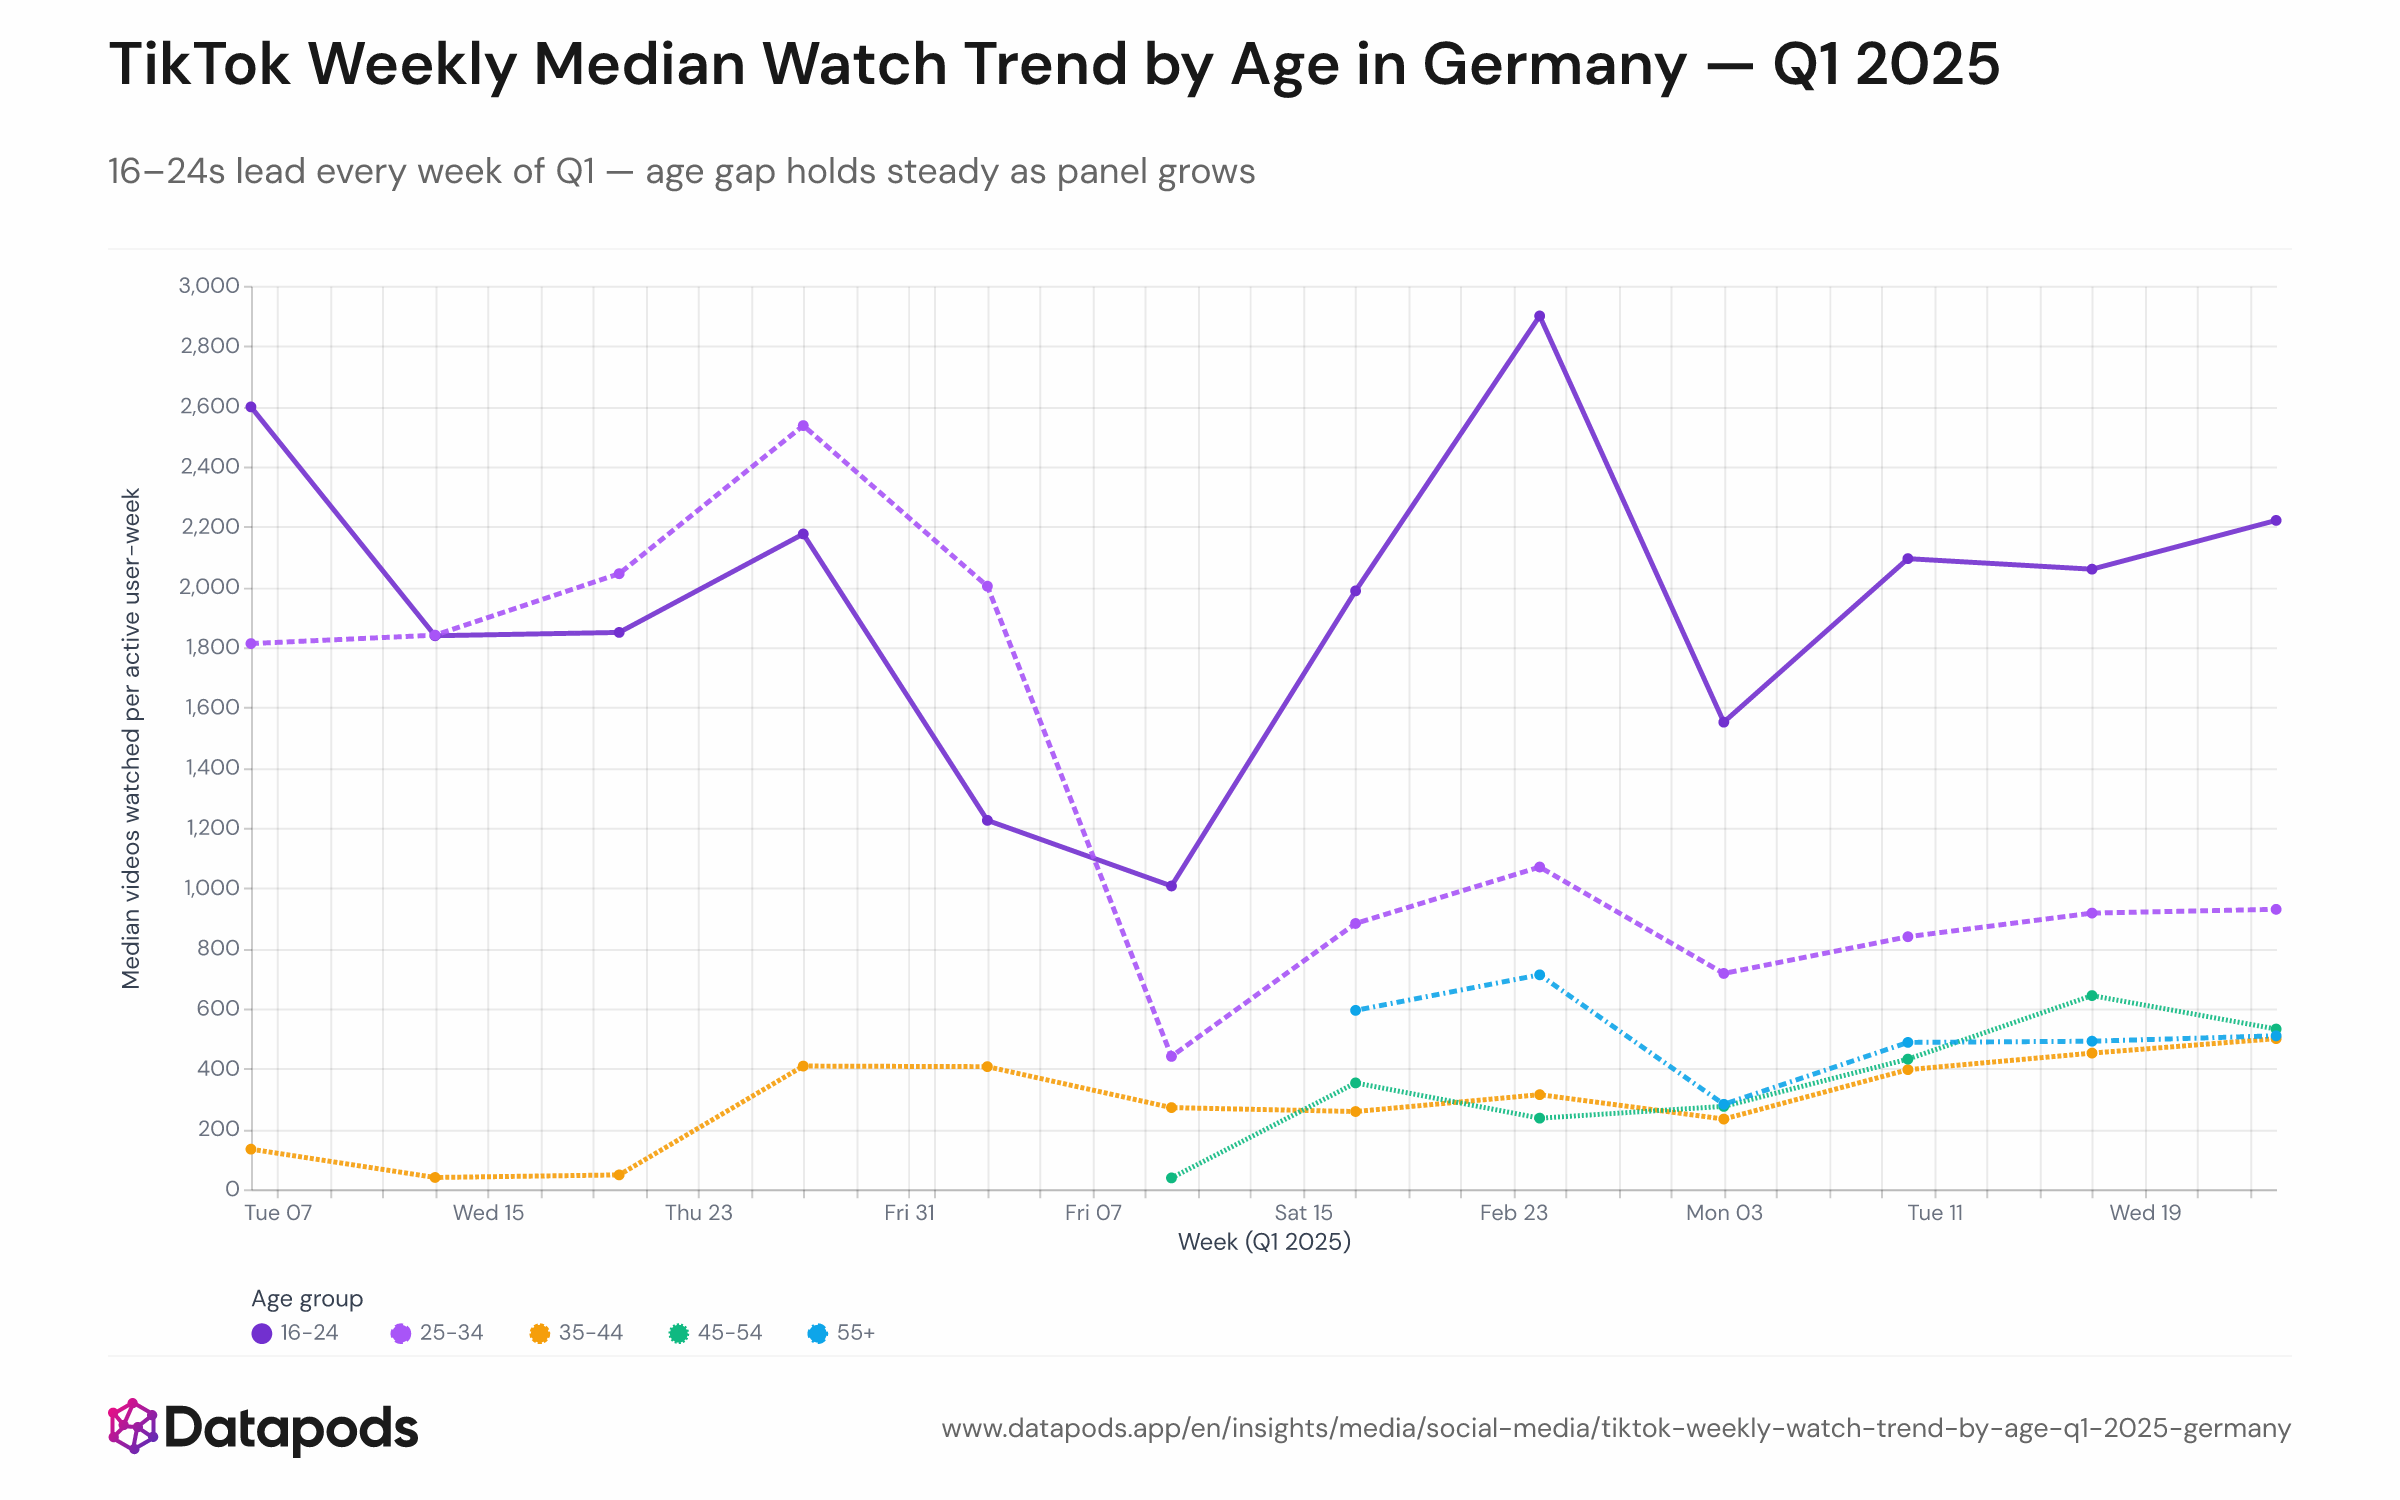
TikTok Weekly Median Watch Trend by Age in Germany — Q1 2025Line or area chart with five trend lines, one per age cohort, tracking median weekly videos from week starting Jan 6 through week ending Mar 30. 16–24 line (darkest or brightest color) remains highest and relatively flat at 1,500–2,500. 25–34 sits below at 750–1,200. 35–44, 45–54, 55+ cluster tightly in the 200–700 band, with minimal week-to-week movement. All lines are stable with no inversion. The stability of this ranking across 13 weeks confirms that TikTok's age gradient in Germany is a structural feature of user behavior, not driven by seasonal events or temporary engagement surges. Even as panel sample composition shifted (early January had sparse consent; February onward more complete), the relative ordering and magnitude of the gap persisted, indicating the finding is robust.Line or area chart with five trend lines, one per age cohort, tracking median weekly videos from week starting Jan 6 through week ending Mar 30. 16–24 line (darkest or brightest color) remains highest and relatively flat at 1,500–2,500. 25–34 sits below at 750–1,200. 35–44, 45–54, 55+ cluster tightly in the 200–700 band, with minimal week-to-week movement. All lines are stable with no inversion.

The stability of this ranking across 13 weeks confirms that TikTok's age gradient in Germany is a structural feature of user behavior, not driven by seasonal events or temporary engagement surges. Even as panel sample composition shifted (early January had sparse consent; February onward more complete), the relative ordering and magnitude of the gap persisted, indicating the finding is robust.
Line or area chart with five trend lines, one per age cohort, tracking median weekly videos from week starting Jan 6 through week ending Mar 30. 16–24 line (darkest or brightest color) remains highest and relatively flat at 1,500–2,500. 25–34 sits below at 750–1,200. 35–44, 45–54, 55+ cluster tightly in the 200–700 band, with minimal week-to-week movement. All lines are stable with no inversion. The stability of this ranking across 13 weeks confirms that TikTok's age gradient in Germany is a structural feature of user behavior, not driven by seasonal events or temporary engagement surges. Even as panel sample composition shifted (early January had sparse consent; February onward more complete), the relative ordering and magnitude of the gap persisted, indicating the finding is robust.
Sample size
n = 698
Data date
Q1 2025
Segment
All segments
Platform
TikTok
Market
Germany
Info
Sample size
n = 698
Data date
Q1 2025
Segment
All segments
Platform
TikTok
Market
Germany

Analysis

The age-based viewing gap is not seasonal or volatile. Across all 13 weeks of Q1 2025, 16–24-year-olds maintain the highest median weekly watch count, consistently staying above 1,500 videos. Simultaneously, 35–44, 45–54, and 55+ cohorts cluster around 200–700 per week, maintaining their relative rank throughout the quarter. This structural consistency indicates the gap reflects fundamental behavioral differences, not temporary market conditions or measurement noise.


This analysis is based on public segment data. For deeper cuts, use our Enterprise interface.

Related statistics

See all Social Media
  • News Content Share of Weekly TikTok Views Among News Followers — Germany 2025

    2025
  • News vs. Entertainment Watch-Through Rate on TikTok — Germany 2025

    2025
  • TikTok News Account Following by Age in Germany — 2025

    2025
  • Unlock deeper cuts

    Enterprise
See all Social Media

Methodology

Median watch count per active user, computed for each age cohort within each ISO week of Q1 2025 (weeks starting Monday, Jan 6 – Mar 30). Weeks with fewer than 5 active users per cohort excluded. Panel size grew over Q1 as more users granted TikTok consent; within-week medians remain robust to panel growth because each week is analyzed as an independent cross-section.


These insights are based on the Datapods Panel. Our data comes exclusively from users who are compensated for their anonymity. Become part of the panel & earn from your data