Datapods|Insights
Consumption
Online ShoppingProduct CategoriesRetailSocial Commerce
Digital
Web & BrowsingSearch QueriesApps & MobileAdvertising
Media
Video & StreamingSocial MediaTrends & TopicsUsage Behavior
Blog|For BusinessFor Consumers
Datapods|Insights
ConsumptionOnline ShoppingProduct CategoriesRetailSocial CommerceDigitalWeb & BrowsingSearch QueriesApps & MobileAdvertisingMediaVideo & StreamingSocial MediaTrends & TopicsUsage BehaviorBlogFor BusinessFor Consumers
InsightsMediaSocial Media
Datapods

Talk to people who actually bought your product.

Use Cases

  • Churn & Win-Back
  • Product & Concept Testing
  • Ad & Creative Testing
  • Customer Journey
  • Competitive Intelligence
  • Audiences & Segmentation
  • Influencers & Creators

Industries

  • Grocery & Drugstore
  • CPG & Brands
  • E-Commerce & Marketplaces
  • Telco & Subscriptions
  • Media & Streaming
  • Apps & Digital

Platform

  • AI Research Agent
  • AI Interviewer
  • Quant Surveys
  • Audience Builder
  • Data API
  • Social Attribution

Company

  • Home
  • About
  • For Consumers
  • The Datapods Panel
  • Insights
  • Contact
  • Blog

Legal

  • Imprint
  • Privacy Policy
  • User Agreement App
  • Privacy Policy App
  • User Agreement Platform
  • Privacy Policy Platform
  • Cookie Policy

©2026 Datapods.app. All rights reserved.

EU Co-financedNRW

TikTok Daily Active Rate by Age in Germany — Q1 2025

Results as of 28.04.2026

Review Q1 2025: 16–24-year-olds open TikTok on 91% of observed days — near-daily for every cohort
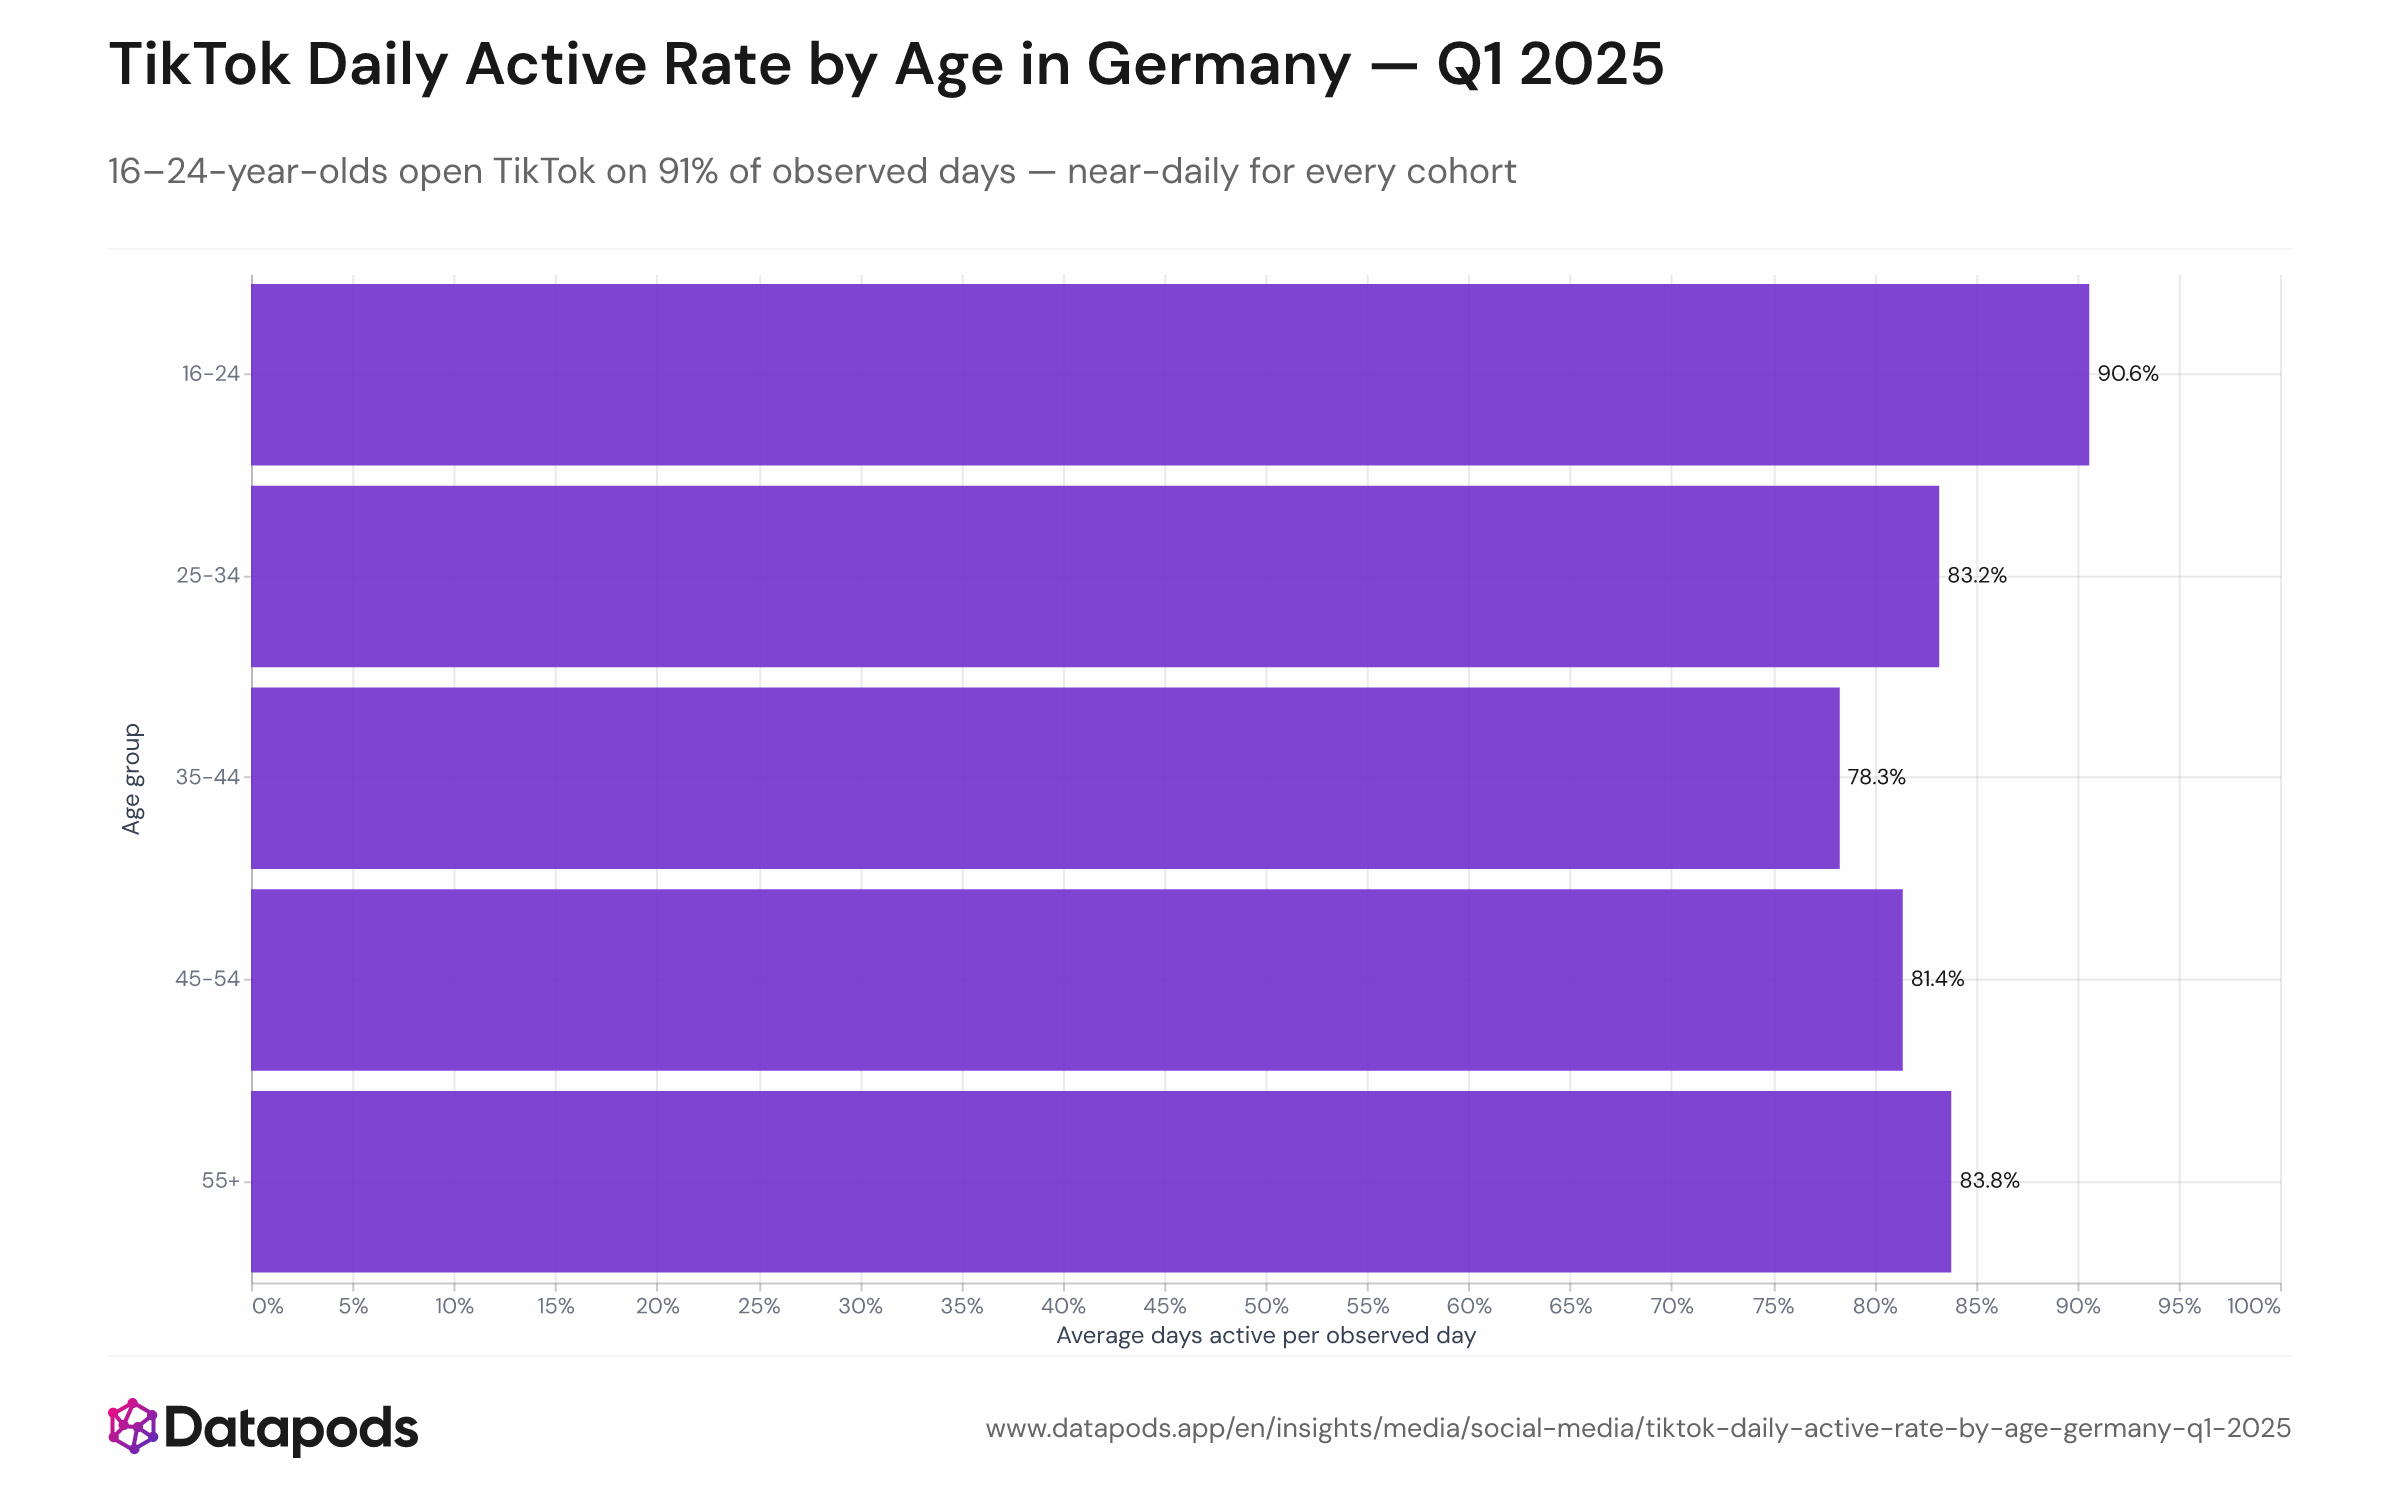
TikTok Daily Active Rate by Age in Germany — Q1 2025Bar chart showing average daily-active rate (share of observed days with ≥1 watch event) by age cohort. Rates range from 78% (35–44) to 91% (16–24), with all other cohorts between 83–88%. Error bars or ranges may be included to show variation. TikTok's consistency across age cohorts aligns with global usage patterns, where the app has become a daily habit even for older demographics. While daily active rates converge, per-user watch volume diverges sharply by age, indicating that older cohorts 'check in' to the app with less intensity — shorter or fewer sessions per day — while Gen Z sustains longer and more frequent engagement windows.Bar chart showing average daily-active rate (share of observed days with ≥1 watch event) by age cohort. Rates range from 78% (35–44) to 91% (16–24), with all other cohorts between 83–88%. Error bars or ranges may be included to show variation.

TikTok's consistency across age cohorts aligns with global usage patterns, where the app has become a daily habit even for older demographics. While daily active rates converge, per-user watch volume diverges sharply by age, indicating that older cohorts 'check in' to the app with less intensity — shorter or fewer sessions per day — while Gen Z sustains longer and more frequent engagement windows.
Bar chart showing average daily-active rate (share of observed days with ≥1 watch event) by age cohort. Rates range from 78% (35–44) to 91% (16–24), with all other cohorts between 83–88%. Error bars or ranges may be included to show variation. TikTok's consistency across age cohorts aligns with global usage patterns, where the app has become a daily habit even for older demographics. While daily active rates converge, per-user watch volume diverges sharply by age, indicating that older cohorts 'check in' to the app with less intensity — shorter or fewer sessions per day — while Gen Z sustains longer and more frequent engagement windows.
Sample size
n = 698
Data date
Q1 2025
Segment
All segments
Platform
TikTok
Market
Germany
Info
Sample size
n = 698
Data date
Q1 2025
Segment
All segments
Platform
TikTok
Market
Germany

Analysis

TikTok displays habit-forming behavior across all ages in Germany. Even the cohort with the lowest daily-active rate — 35–44-year-olds at 78% — opens the app on roughly 4 out of 5 days. The 16–24 group reaches 91%, while 25–34, 45–54, and 55+ range between 83–88%. This consistency suggests that TikTok has achieved quasi-daily status regardless of age; differences in total consumption stem from session count and length, not visit frequency.


This analysis is based on public segment data. For deeper cuts, use our Enterprise interface.

Related statistics

See all Social Media
  • News Content Share of Weekly TikTok Views Among News Followers — Germany 2025

    2025
  • TikTok Weekly Median Watch Trend by Age in Germany — Q1 2025

    Q1 2025
  • Unlock deeper cuts

    Enterprise
  • News vs. Entertainment Watch-Through Rate on TikTok — Germany 2025

    2025
See all Social Media

Methodology

Per-user metric: active days ÷ total observed days within Q1 2025. Observed days defined as the span from first to last watch event for each user. Reported as unweighted mean (average) by cohort. Sample: 698 users (16–24 n=173, 25–34 n=202, 35–44 n=192, 45–54 n=80, 55+ n=51).


These insights are based on the Datapods Panel. Our data comes exclusively from users who are compensated for their anonymity. Become part of the panel & earn from your data