
Zalando Loses Fashion Wallet Share to Shein
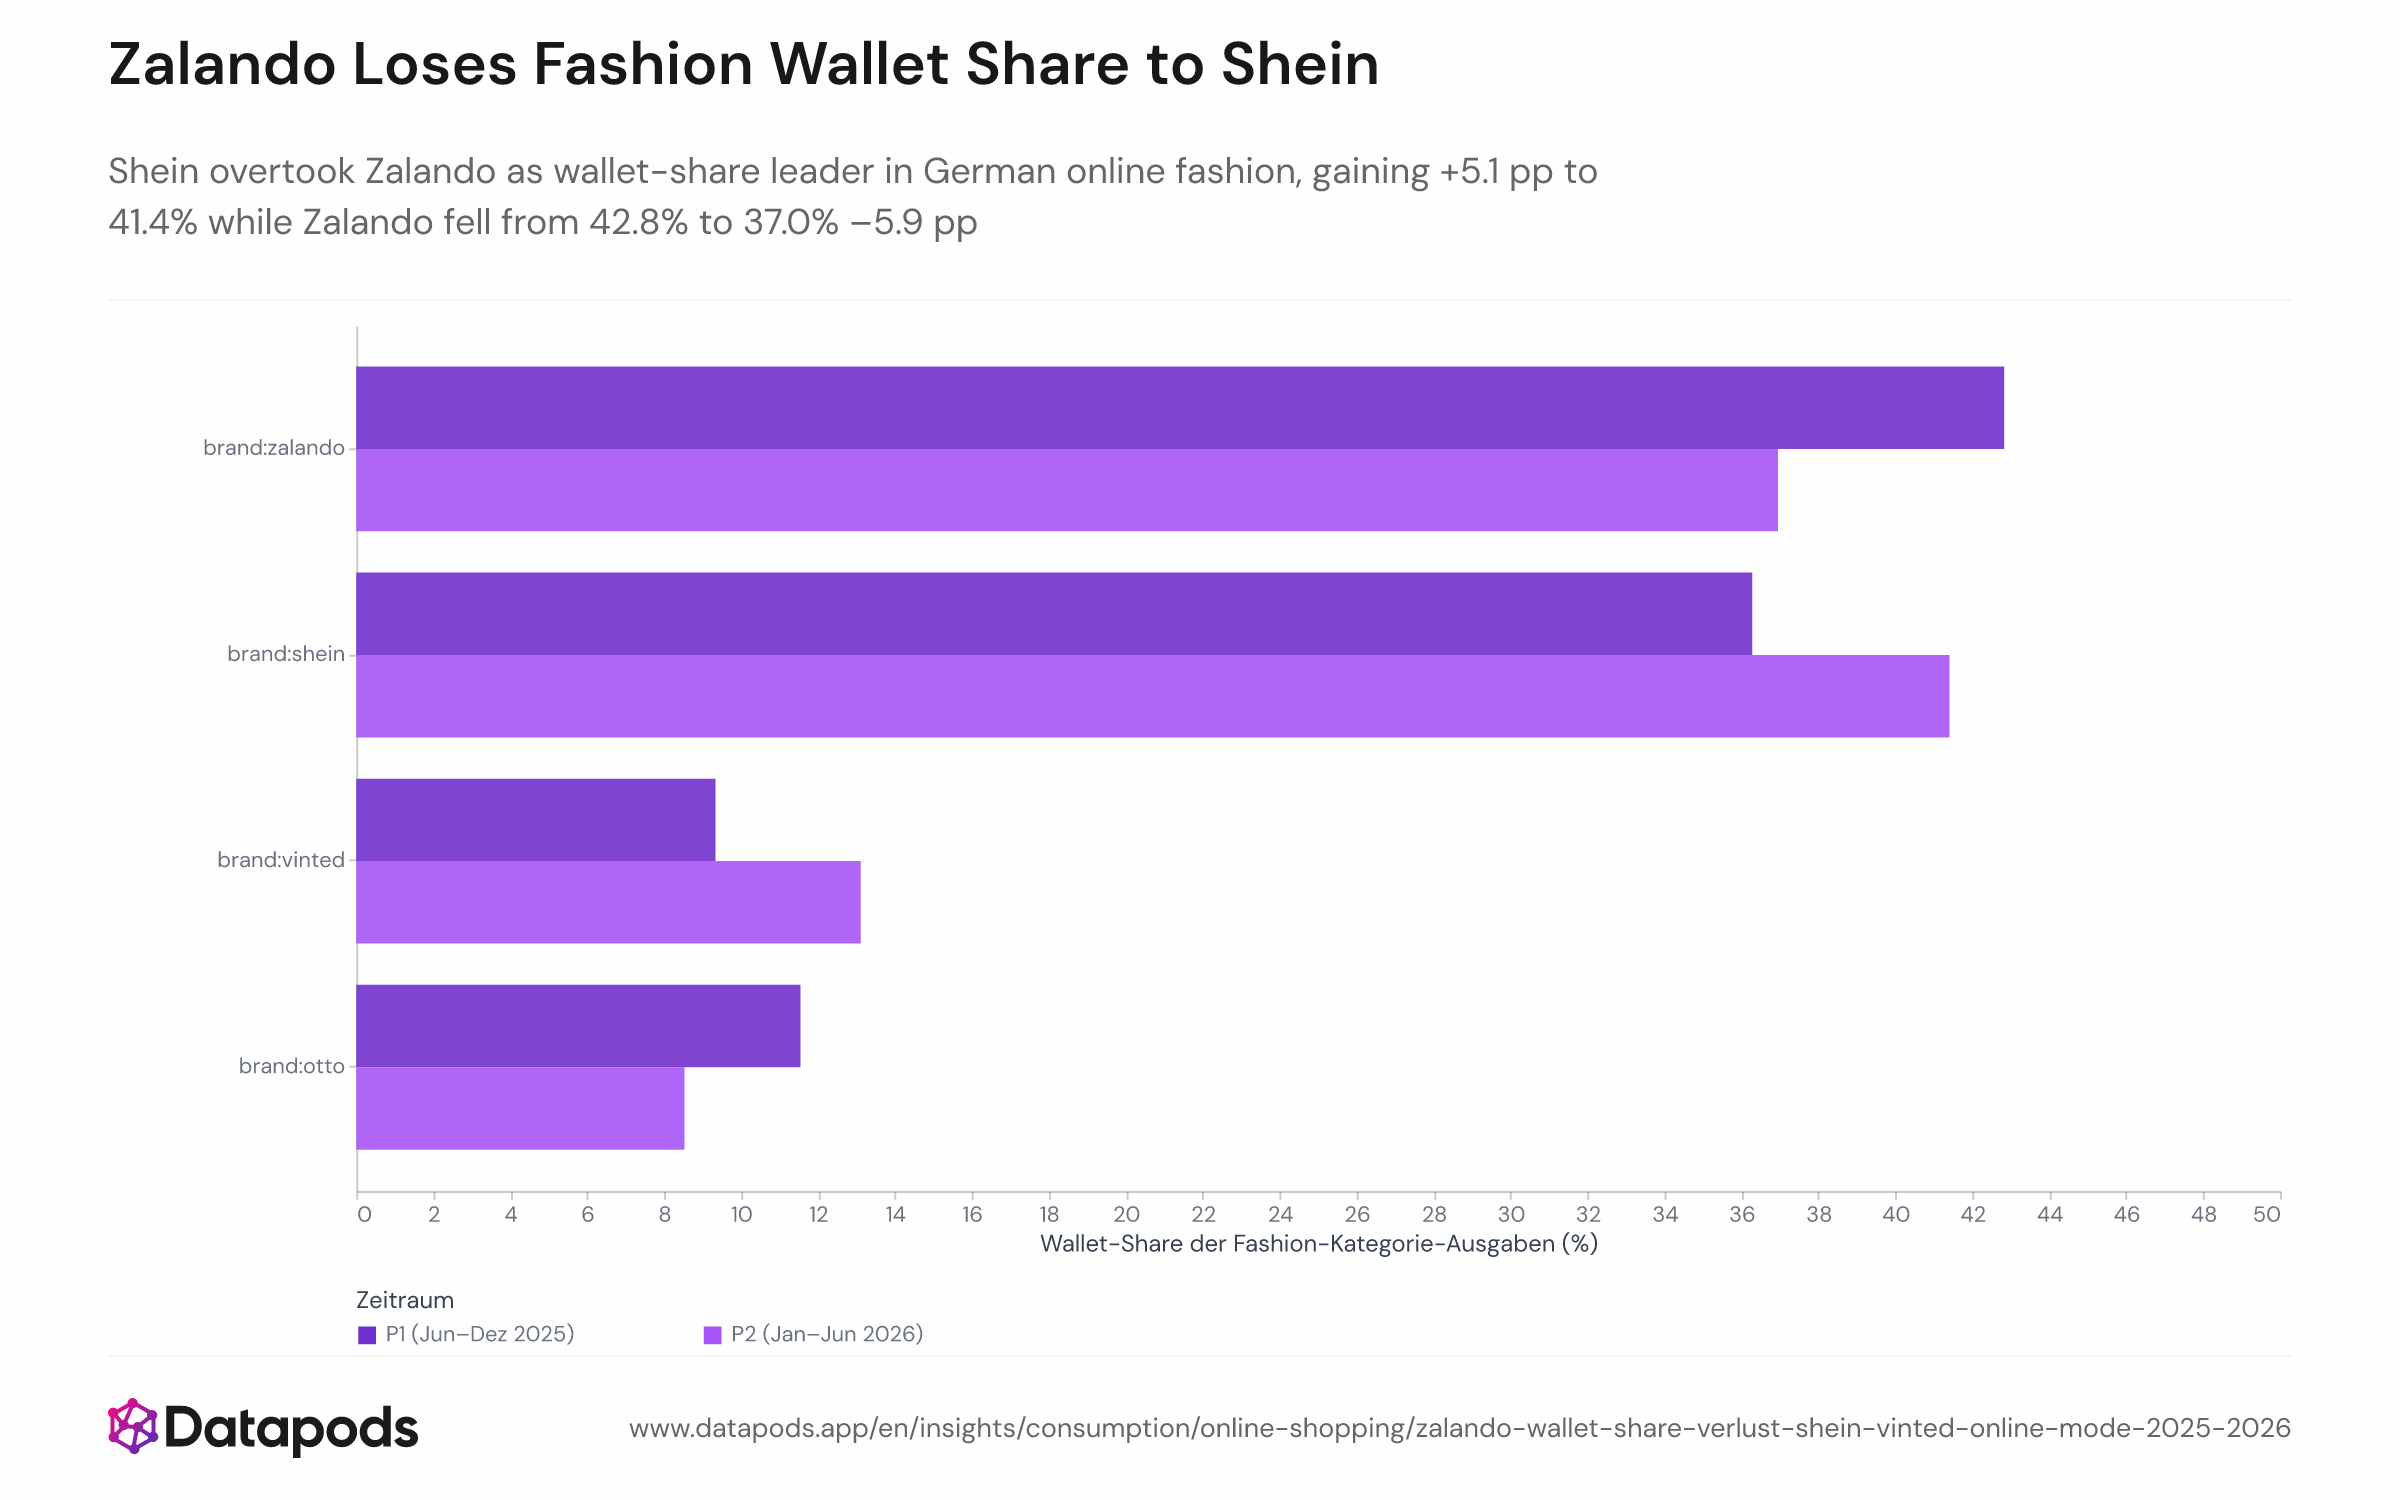
Review H1 2025 vs. H1 2026: Shein overtook Zalando as wallet-share leader in German online fashion, gaining +5.1 pp to 41.4% while Zalando fell from 42.8% to 37.0% –5.9 pp
Info
- Sample size
- n = 454
- Data date
- H1 2025 vs. H1 2026
- Segment
- All segments
- Platform
- Purchases
- Market
- Germany
Analysis
Among loyal German online fashion shoppers active across all four tracked brands, Shein dethroned Zalando as the top destination by euro spend in just twelve months — a shift of nearly 6 percentage points that signals a structural realignment, not a seasonal blip.
Price pressure reshapes where Germans spend on fashion
The wallet-share swing is anchored in a steep price gap: Shein's average order value sits far below Zalando's, meaning shoppers get dramatically more items per euro spent. This price sensitivity is well-documented in Germany — German consumers are highly price-conscious, with 75% expecting high cost-of-living pressures to persist through 2025. Shein accelerated its German push precisely into this window: Shein's German user base grew 24% — the highest among major EU markets. Vinted reinforced the shift from the second-hand side: in 2025, Vinted successfully turned around its performance in Germany by improving its product proposition and investing in the market at good ROI, resulting in high growth. Combined, Shein and Vinted gained 8.9 percentage points of wallet share over the period, almost entirely at the expense of Zalando and Otto. For fashion marketers, the data points to a two-speed market: premium incumbents defending margin while value platforms capture an expanding share of actual consumer spending.
This analysis is based on public segment data. For deeper cuts, use our Enterprise interface.
Methodology
The analysis tracks apparel and accessories spending (covering items such as clothing, shoes, and bags) by a cohort of loyal online fashion shoppers in Germany who made purchases from at least one of four brands — Otto, Zalando, Shein, and Vinted — in both the first period (late June to late December 2025) and the second period (late December 2025 to late June 2026). Wallet share is each brand's portion of the cohort's total euro spend across all four brands within each six-month window. Average order values by brand were measured to verify the price positioning of each platform before computing the shifts.
These insights are based on the Datapods Panel. Our data comes exclusively from users who are compensated for their anonymity. Become part of the panel & earn from your data