Datapods|Insights
Consumption
Online ShoppingProduct CategoriesRetailSocial Commerce
Digital
Web & BrowsingSearch QueriesApps & MobileAdvertising
Media
Video & StreamingSocial MediaTrends & TopicsUsage Behavior
Resources|For BusinessFor Consumers
Datapods|Insights
ConsumptionOnline ShoppingProduct CategoriesRetailSocial CommerceDigitalWeb & BrowsingSearch QueriesApps & MobileAdvertisingMediaVideo & StreamingSocial MediaTrends & TopicsUsage BehaviorResourcesFor BusinessFor Consumers
InsightsConsumptionOnline Shopping
Datapods

Talk to people who actually bought your product.

Use Cases

  • Churn & Win-Back
  • Product & Concept Testing
  • Ad & Creative Testing
  • Customer Journey
  • Competitive Intelligence
  • Audiences & Segmentation
  • Influencers & Creators

Industries

  • Grocery & Drugstore
  • CPG & Brands
  • E-Commerce & Marketplaces
  • Telco & Subscriptions
  • Media & Streaming
  • Apps & Digital

Platform

  • AI Research Agent
  • AI Interviewer
  • Quant Surveys
  • Audience Builder
  • Data API
  • Social Attribution

Company

  • Home
  • About
  • For Consumers
  • The Datapods Panel
  • Insights
  • Contact
  • Resources

Legal

  • Imprint
  • Privacy Policy
  • User Agreement App
  • Privacy Policy App
  • User Agreement Platform
  • Privacy Policy Platform
  • Cookie Policy

©2026 Datapods.app. All rights reserved.

EU Co-financedNRW

Browsing Trends vs. Real Spend by Category

Results as of 15.07.2026

Review Jul 2025 – Jun 2026: Subscriptions are the only category with a +2.1 pp rise in real spend share — while Health & Beauty browsing growth leaves no trace in actual purchases.
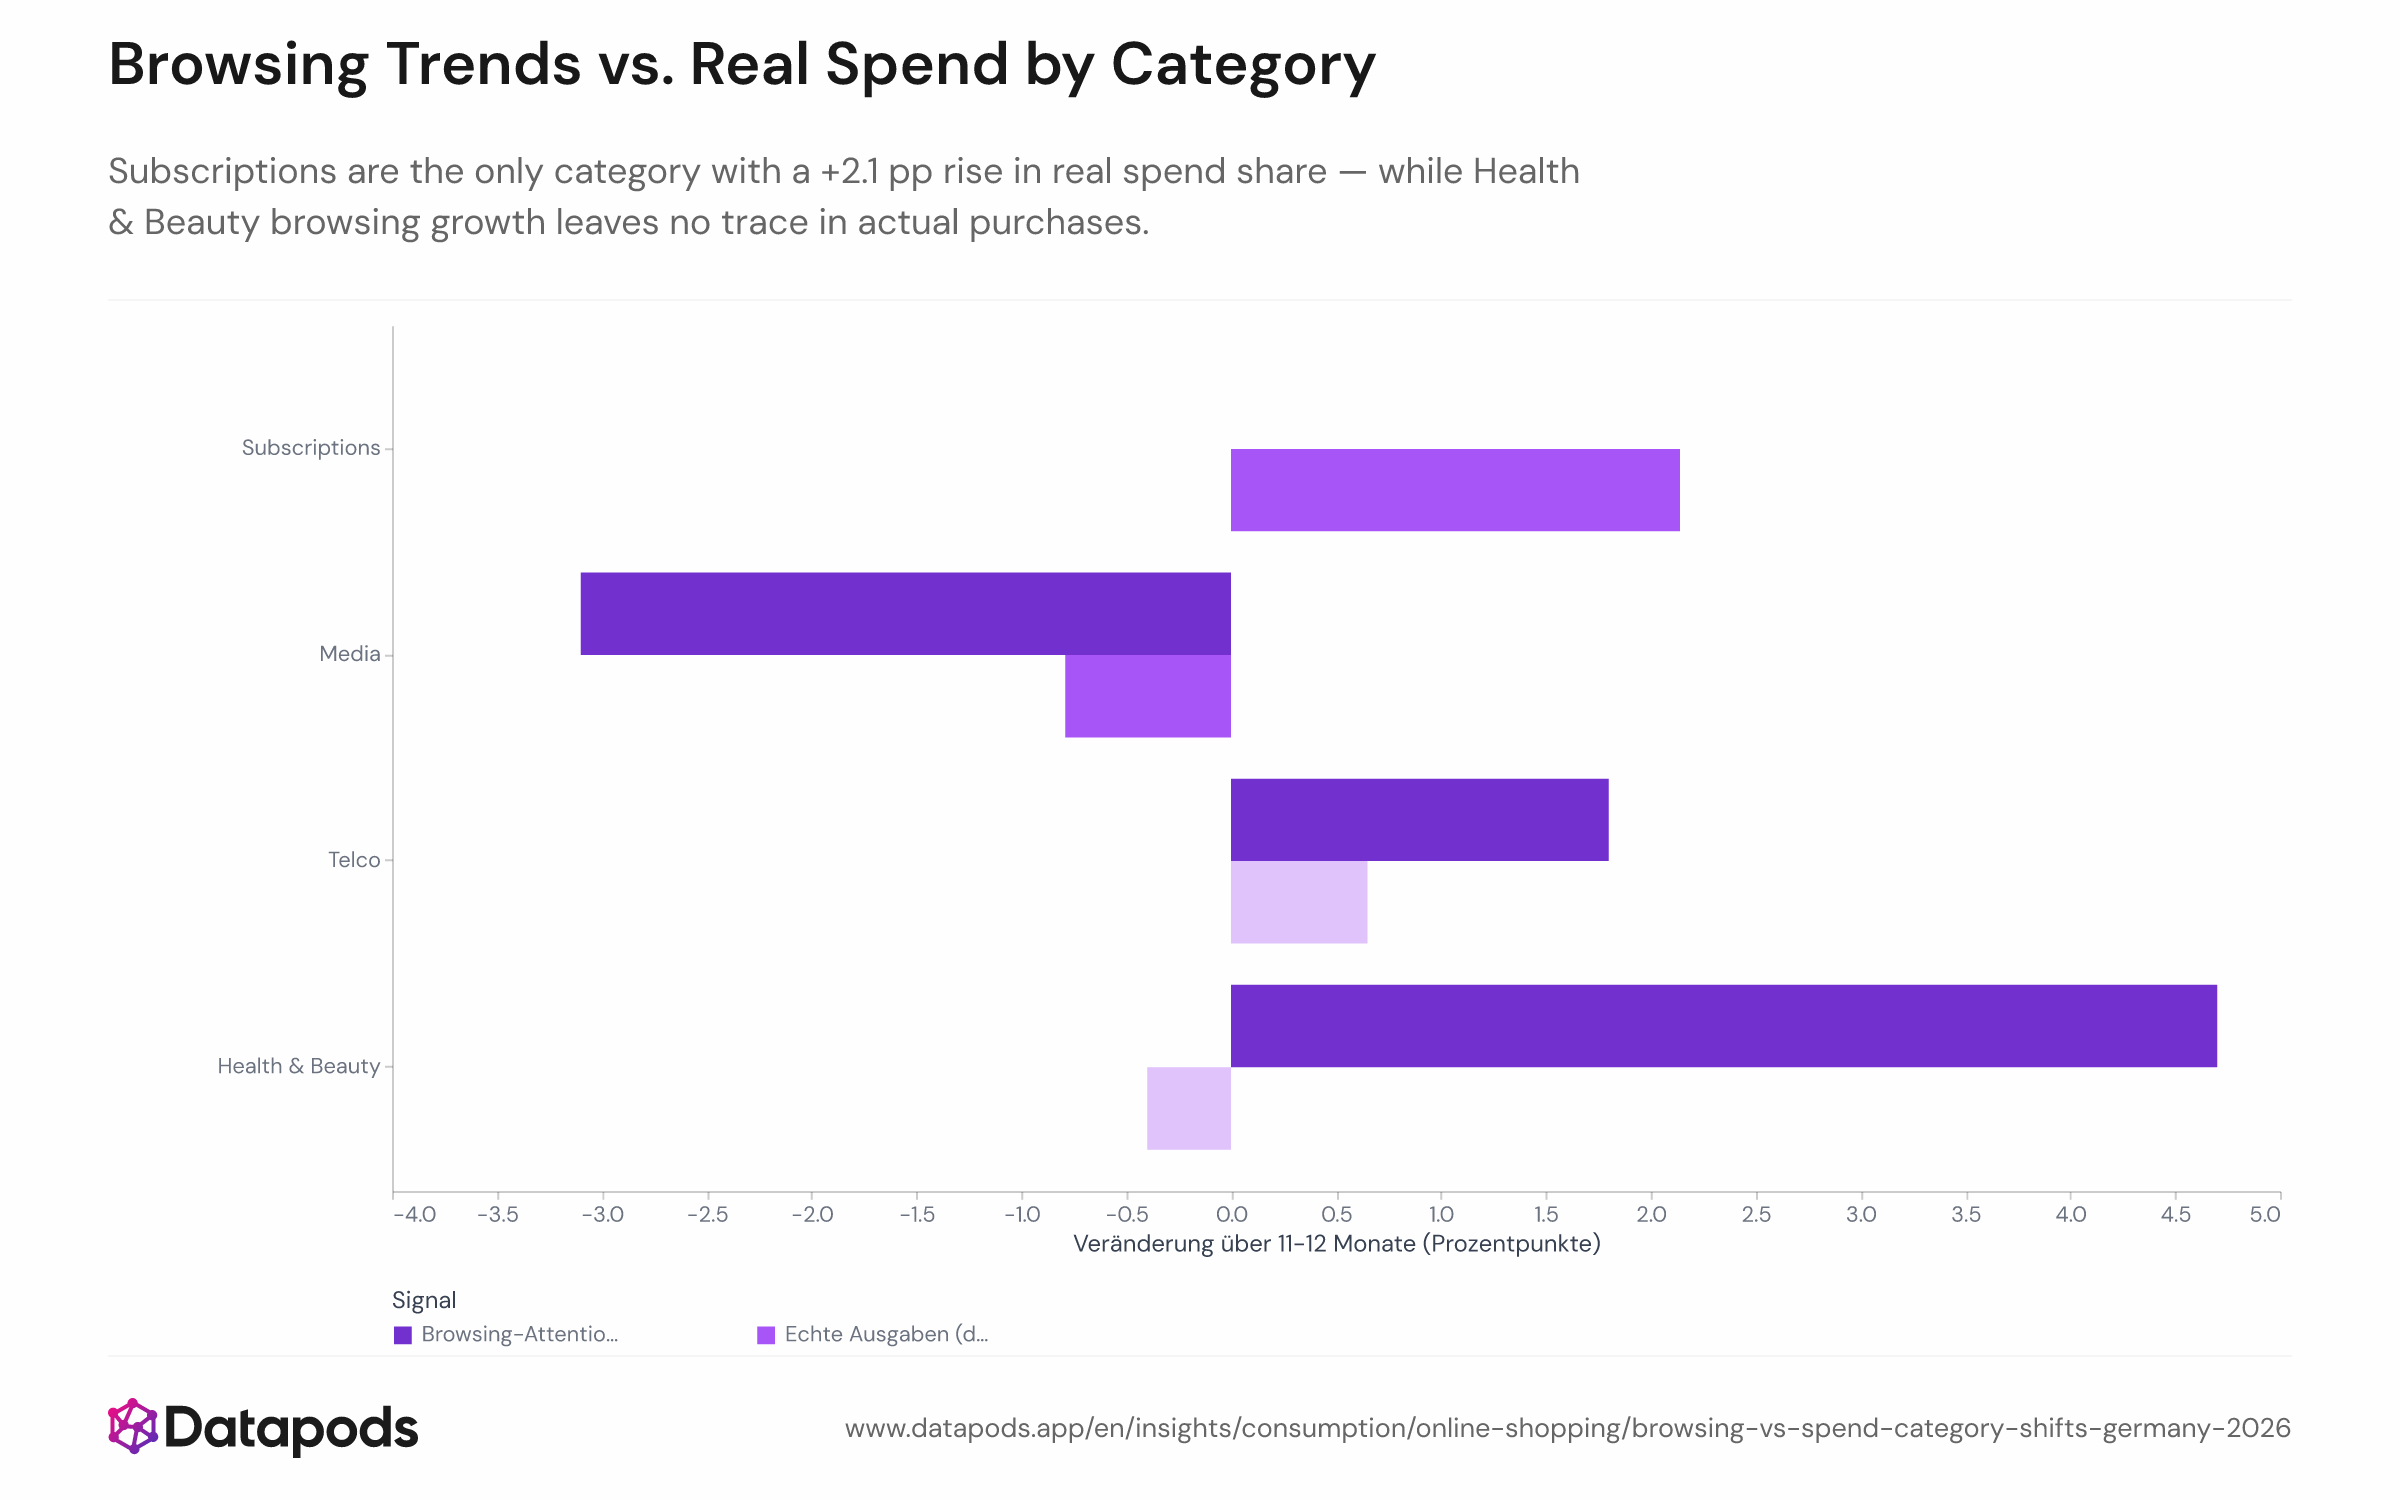
Browsing Trends vs. Real Spend by CategoryBar chart comparing the percentage-point change in browsing-attention share versus actual purchase spend share for four product categories — Health & Beauty, Telecommunications, Media, and Subscriptions — over the period July 2025 to June 2026. Two bars per category show the browsing signal (from a prior browsing analysis) against the spend signal (from transaction data), illustrating where the two signals diverge.Bar chart comparing the percentage-point change in browsing-attention share versus actual purchase spend share for four product categories — Health & Beauty, Telecommunications, Media, and Subscriptions — over the period July 2025 to June 2026. Two bars per category show the browsing signal (from a prior browsing analysis) against the spend signal (from transaction data), illustrating where the two signals diverge.
Bar chart comparing the percentage-point change in browsing-attention share versus actual purchase spend share for four product categories — Health & Beauty, Telecommunications, Media, and Subscriptions — over the period July 2025 to June 2026. Two bars per category show the browsing signal (from a prior browsing analysis) against the spend signal (from transaction data), illustrating where the two signals diverge.
Sample size
n = 9,866
Data date
Jul 2025 – Jun 2026
Segment
All segments
Platform
Browsing, Purchases
Market
Germany
Info
Sample size
n = 9,866
Data date
Jul 2025 – Jun 2026
Segment
All segments
Platform
Browsing, Purchases
Market
Germany

Analysis

Subscriptions are the only category where rising browsing attention is confirmed by real money: their share of categorisable online purchase volume climbed from 2.7% to 5.1% between July 2025 and June 2026 — a statistically robust shift marketers can act on. Health & Beauty told the opposite story: browsing-attention grew sharply, but actual spend share moved by just −0.4 percentage points, indistinguishable from flat.

When attention doesn't convert to spend

The browsing-to-purchase gap is well-documented in e-commerce research — industry data consistently shows that only a small fraction of browsing sessions end in a transaction, and category-level attention can diverge sharply from category-level wallet share. In Germany, subscription commerce is expanding rapidly: a 2026 Bitkom survey found that roughly one in four German online shoppers already holds at least one product subscription, and analysts project continued high double-digit growth for the model. Streaming, software, and subscription boxes are structurally recurring transactions — each sign-up compounds the spend share month after month without requiring a new browsing decision. Media one-off purchases moved in the opposite direction, shrinking from ~1.4% to ~0.7% of purchase volume over the same period, consistent with the broader structural shift toward subscription-based media consumption. For marketing planning, the data suggests that browsing-traffic metrics for categories like Health & Beauty should not be used as proxies for spend opportunity without transaction-level validation.


This analysis is based on public segment data. For deeper cuts, use our Enterprise interface.

Related statistics

See all Online Shopping
  • Home & Garden: Interest-to-Purchase Gap

    H1 2026
  • Samsung Buyers: No Single Path to Purchase

    April–July 2026
  • Zalando Loses Fashion Wallet Share to Shein

    H1 2025 vs. H1 2026
  • Unlock deeper cuts

    Enterprise
See all Online Shopping

Methodology

Category spend shares are derived from actual purchase transactions — including Amazon orders, e-mail invoice data, and checkout signals — recorded among active German online shoppers between July 2025 and June 2026. Each month's share reflects that category's portion of all categorisable purchase volume, making the metric independent of changes in the overall shopper base over time. February 2026 was excluded following identification of a data ingestion anomaly that month. Browsing-attention figures come from a parallel product-browsing analysis covering the same 12-month window and are shown here for direct comparison. Trend significance was assessed using linear regression across the monthly data points.


These insights are based on the Datapods Panel. Our data comes exclusively from users who are compensated for their anonymity. Become part of the panel & earn from your data