Datapods|Insights
Consumption
Online ShoppingProduct CategoriesRetailSocial Commerce
Digital
Web & BrowsingSearch QueriesApps & MobileAdvertising
Media
Video & StreamingSocial MediaTrends & TopicsUsage Behavior
Blog|For BusinessFor Consumers
Datapods|Insights
ConsumptionOnline ShoppingProduct CategoriesRetailSocial CommerceDigitalWeb & BrowsingSearch QueriesApps & MobileAdvertisingMediaVideo & StreamingSocial MediaTrends & TopicsUsage BehaviorBlogFor BusinessFor Consumers
InsightsDigitalApps & Mobile
Datapods

Talk to people who actually bought your product.

Use Cases

  • Churn & Win-Back
  • Product & Concept Testing
  • Ad & Creative Testing
  • Customer Journey
  • Competitive Intelligence
  • Audiences & Segmentation
  • Influencers & Creators

Industries

  • Grocery & Drugstore
  • CPG & Brands
  • E-Commerce & Marketplaces
  • Telco & Subscriptions
  • Media & Streaming
  • Apps & Digital

Platform

  • AI Research Agent
  • AI Interviewer
  • Quant Surveys
  • Audience Builder
  • Data API
  • Social Attribution

Company

  • Home
  • About
  • For Consumers
  • The Datapods Panel
  • Insights
  • Contact
  • Blog

Legal

  • Imprint
  • Privacy Policy
  • User Agreement App
  • Privacy Policy App
  • User Agreement Platform
  • Privacy Policy Platform
  • Cookie Policy

©2026 Datapods.app. All rights reserved.

EU Co-financedNRW

Amazon.de Basket Value: App Users vs. Browser-Only Shoppers in Germany — 2025 to Q1 2026

Results as of 14.05.2026

Review Jan 2025 – Mar 2026: Per-order basket value on Amazon.de is statistically identical for app and browser-only shoppers — €26.53 vs. €27.54 mean
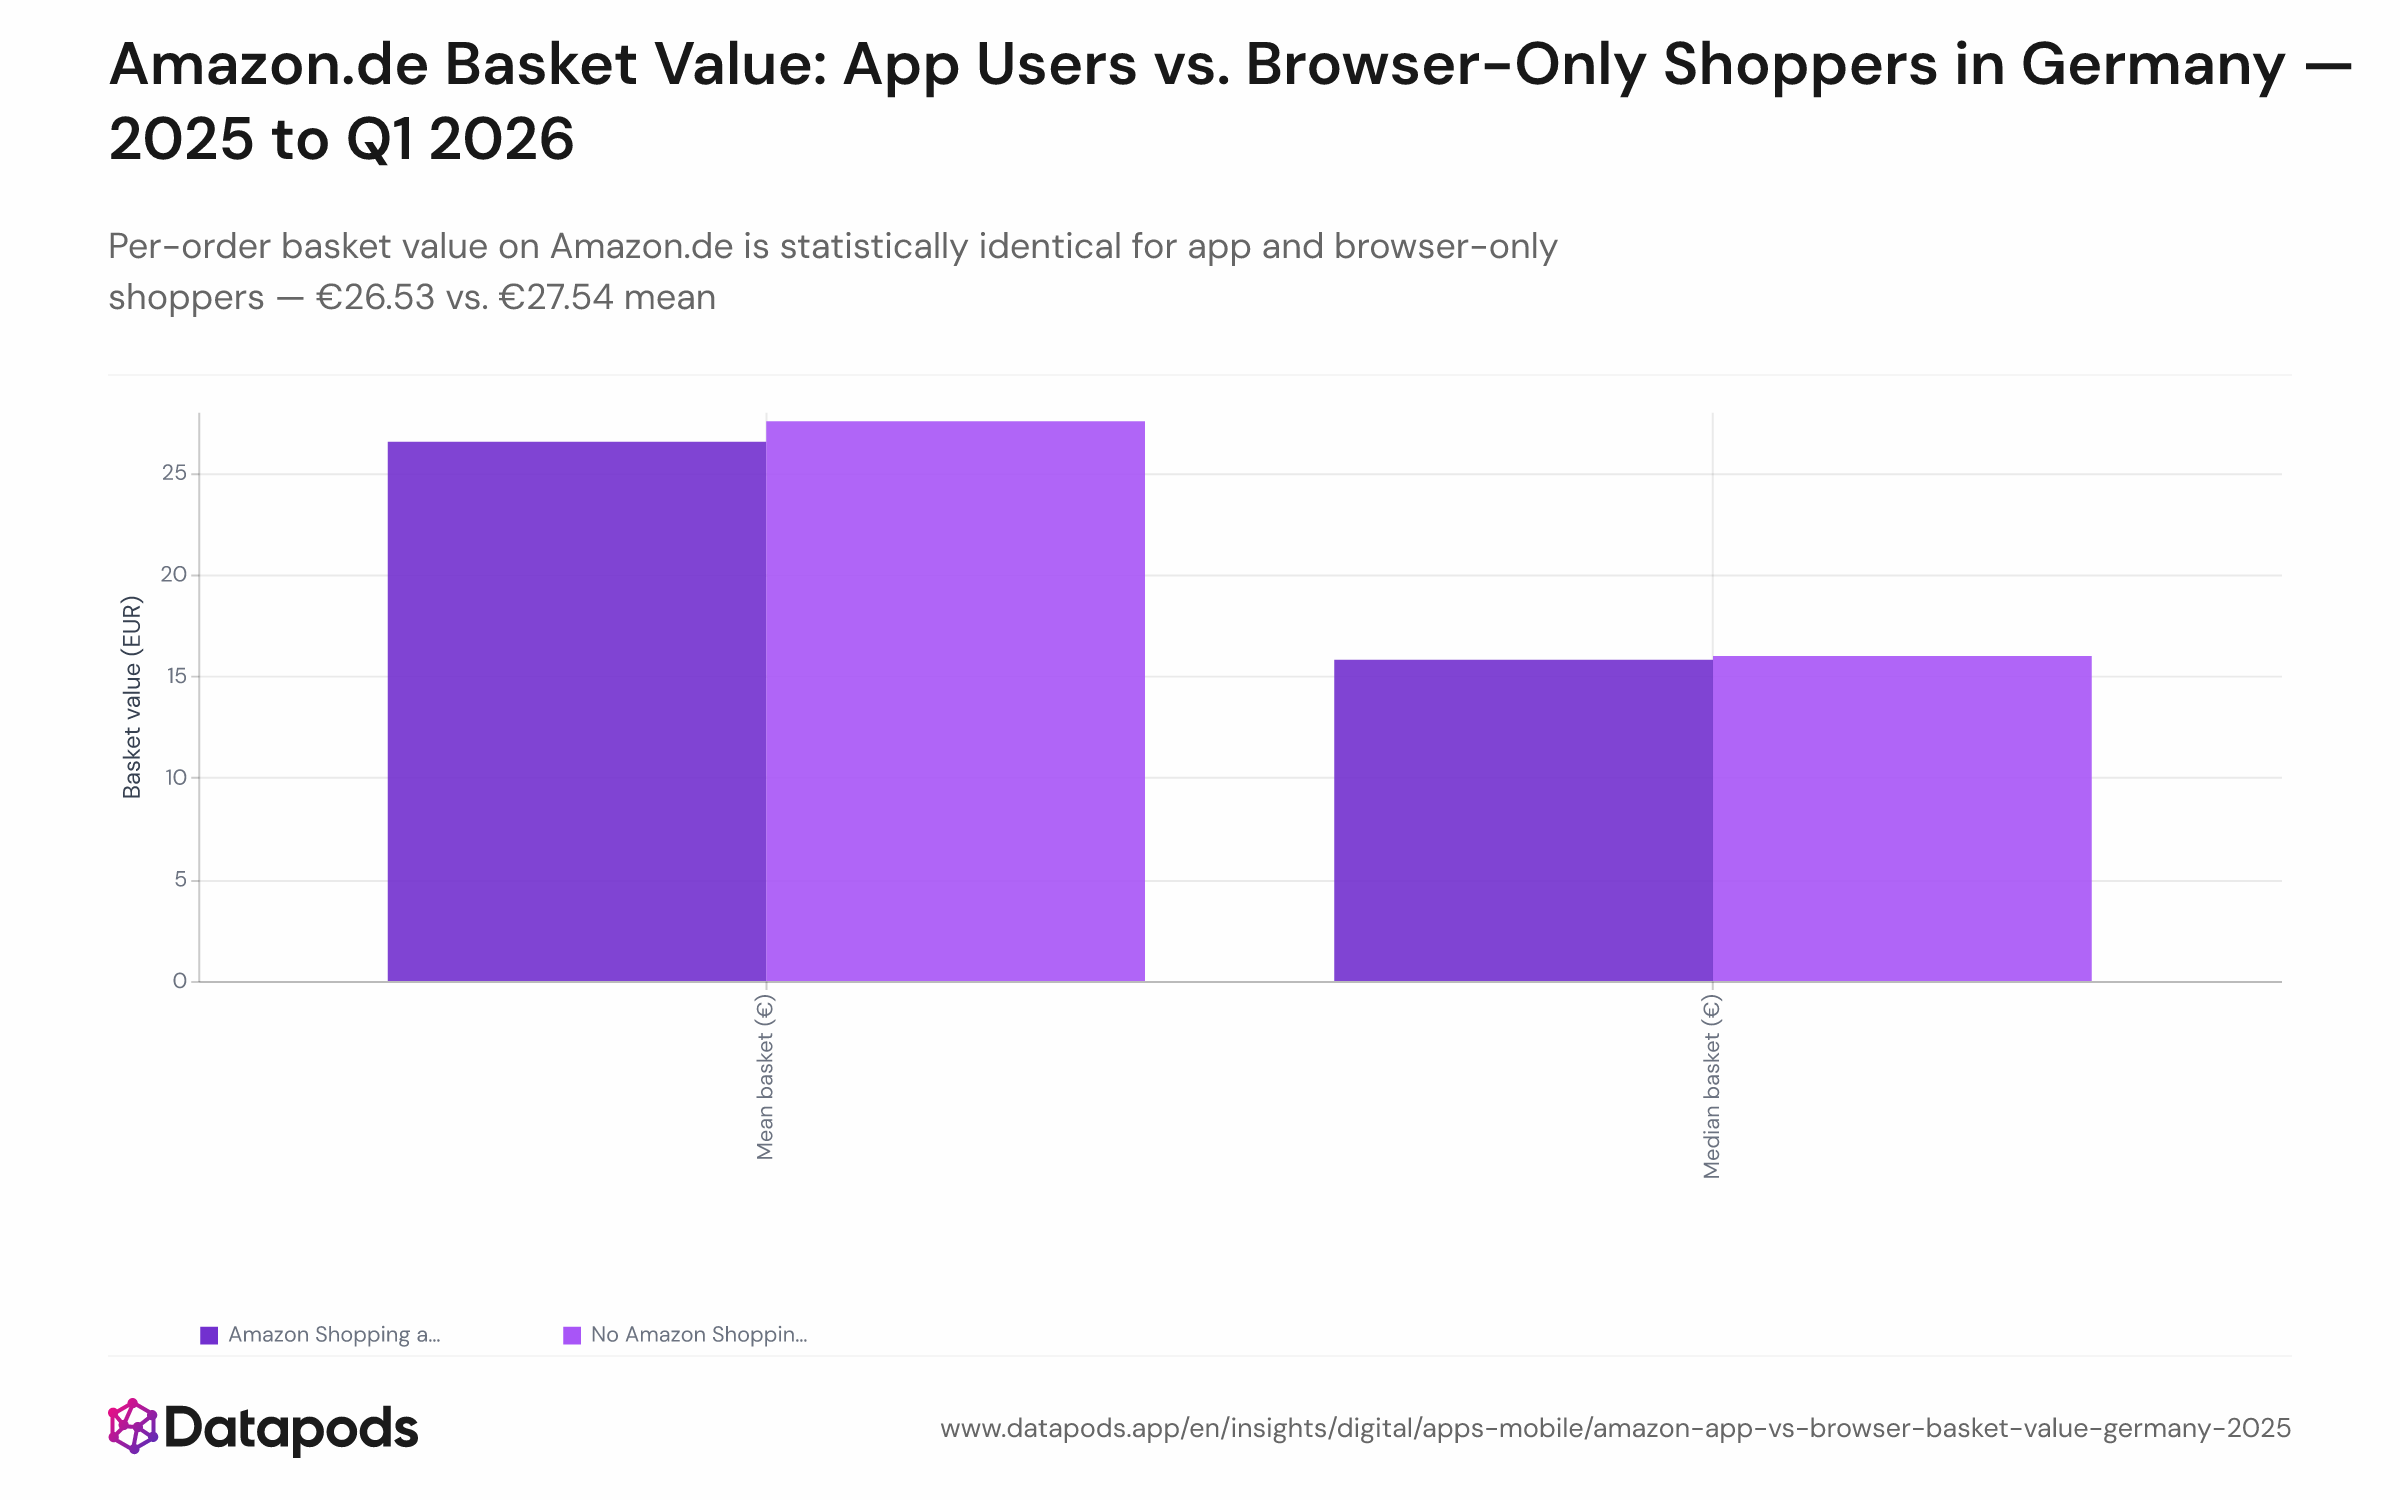
Amazon.de Basket Value: App Users vs. Browser-Only Shoppers in Germany — 2025 to Q1 2026Bar chart comparing mean and median per-order basket value on Amazon.de in Germany between January 2025 and March 2026, for shoppers with the Amazon Shopping app installed (mean €26.53, median €15.80) versus browser-only shoppers (mean €27.54, median €15.99). A second panel or annotation shows total 15-month spend per shopper: €1,513 (app) vs. €1,232 (browser-only).Bar chart comparing mean and median per-order basket value on Amazon.de in Germany between January 2025 and March 2026, for shoppers with the Amazon Shopping app installed (mean €26.53, median €15.80) versus browser-only shoppers (mean €27.54, median €15.99). A second panel or annotation shows total 15-month spend per shopper: €1,513 (app) vs. €1,232 (browser-only).
Bar chart comparing mean and median per-order basket value on Amazon.de in Germany between January 2025 and March 2026, for shoppers with the Amazon Shopping app installed (mean €26.53, median €15.80) versus browser-only shoppers (mean €27.54, median €15.99). A second panel or annotation shows total 15-month spend per shopper: €1,513 (app) vs. €1,232 (browser-only).
Sample size
n = 6,130
Data date
Jan 2025 – Mar 2026
Segment
All segments
Platform
Amazon, Google
Market
Germany
Info
Sample size
n = 6,130
Data date
Jan 2025 – Mar 2026
Segment
All segments
Platform
Amazon, Google
Market
Germany

Analysis

The Amazon Shopping app's commercial impact in Germany is entirely a frequency story, not a ticket-size story. Mean basket value per order is €26.53 for app users and €27.54 for browser-only shoppers; medians are €15.80 versus €15.99 — differences too small to be commercially meaningful. Yet because app users place far more orders, their total Amazon spend over the 15-month window reaches €1,513 per shopper on average, versus €1,232 for browser-only shoppers — a 23% revenue lift driven entirely by purchase cadence.

Frequency, Not Ticket Size, Is the App's Revenue Lever

This pattern is consistent with how Amazon has engineered its app: features like push deal alerts, one-tap reorder, and Subscribe & Save reminders are designed to pull forward purchases and reduce friction on small repeat orders — not to upsell into larger baskets. The median order of roughly €16 points to a steady stream of everyday essentials and top-up buys rather than considered, high-value purchases. For sellers and brand managers on Amazon.de, this means app presence correlates with wallet share through volume, not through premium positioning. The frequency gap underpinning this spend difference is detailed in the order frequency comparison.


This analysis is based on public segment data. For deeper cuts, use our Enterprise interface.

Related statistics

See all Apps & Mobile
  • MagentaTV App Engagement: UEFA Euro 2024 vs. FIFA World Cup 2026 in Germany — Tournament Comparison

    Euro 2024 (June 2024) vs. World Cup 2026 (June 2026)
  • MagentaTV App Engagement in Germany — FIFA World Cup 2026 Kickoff (June 2026)

    May 12 – June 14, 2026
  • MagentaTV Subscription & Sport Page Sessions on Telekom.de, Germany — FIFA World Cup 2026 Kickoff (June 2026)

    May 12 – June 14, 2026
  • Unlock deeper cuts

    Enterprise
See all Apps & Mobile

Methodology

The same cohort of German panelists with confirmed Amazon.de purchases between January 2025 and March 2026 used in the order-frequency analysis. Per-order basket value is the total amount paid per individual order. Per-user statistics — mean and median basket value — were computed first at the individual order level, then summarised at the shopper level within each cohort. Orders above €5,000 were excluded to remove obvious outliers such as bulk electronics purchases. App users are defined as Google Play installers of the Amazon Shopping app; browser-only shoppers are those without it, both restricted to panelists with verified coverage across both data sources.


These insights are based on the Datapods Panel. Our data comes exclusively from users who are compensated for their anonymity. Become part of the panel & earn from your data