
YouTube Product-Review Videos and Amazon.de Purchase Conversion in Germany — 2025
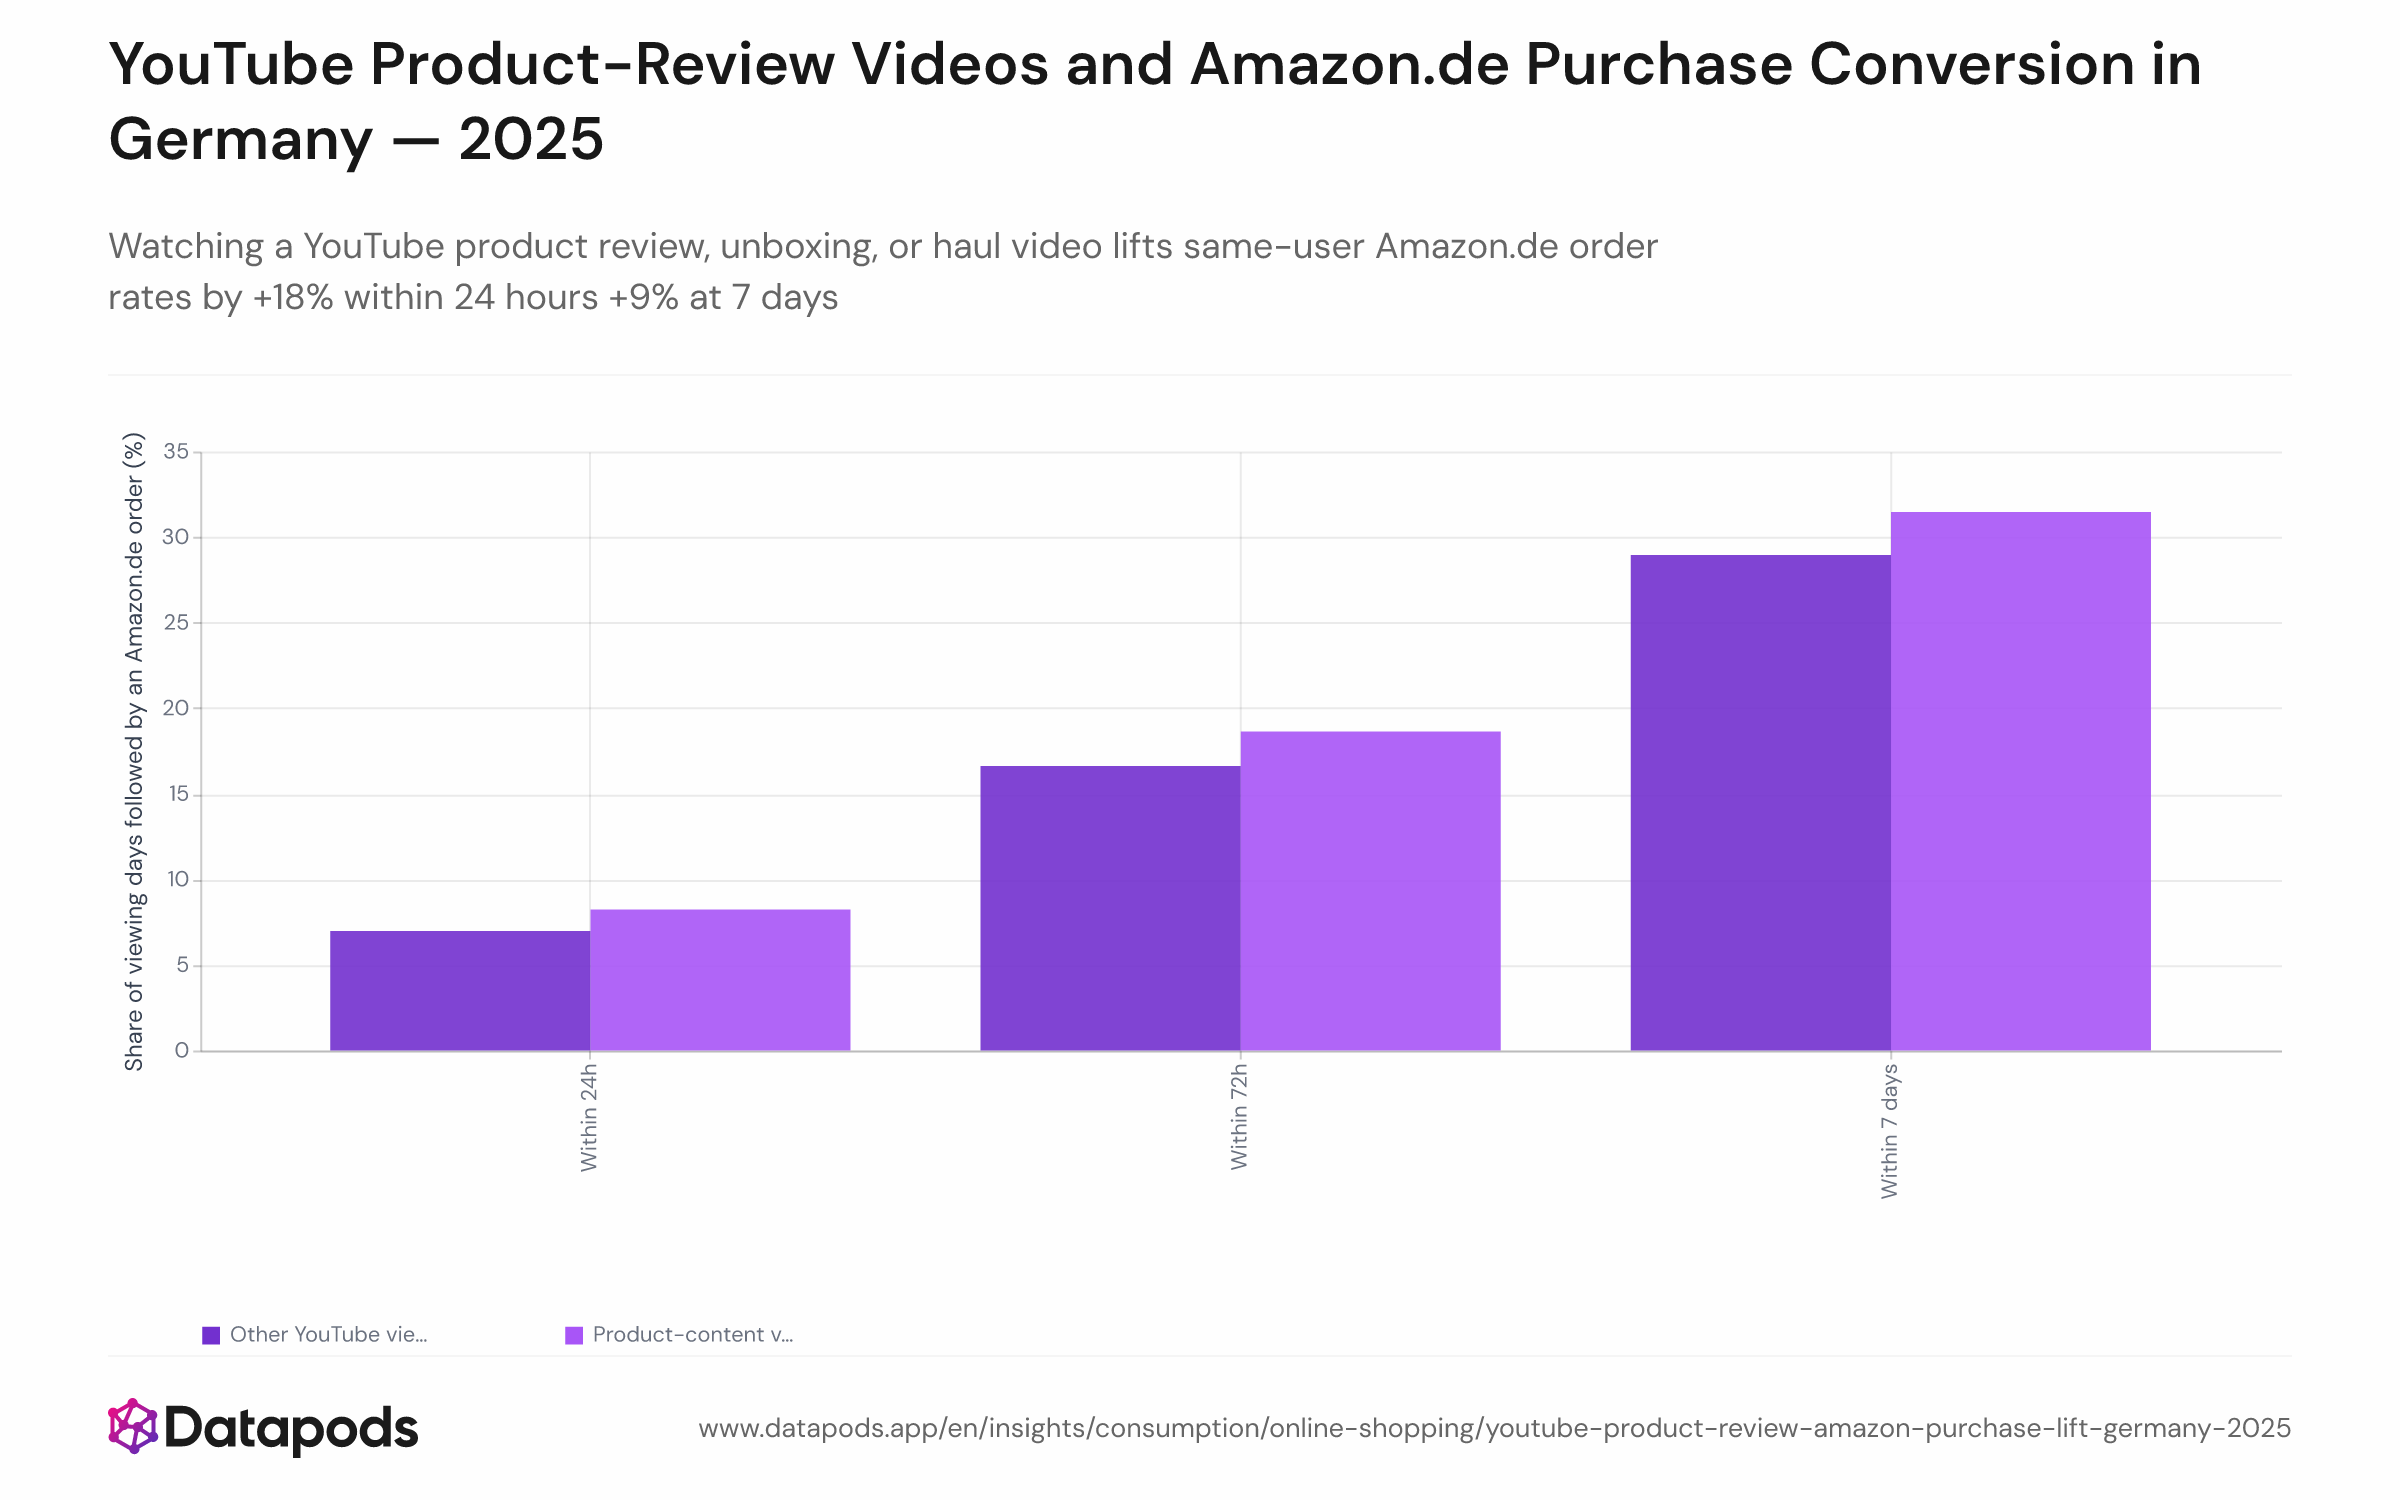
Review 2025: Watching a YouTube product review, unboxing, or haul video lifts same-user Amazon.de order rates by +18% within 24 hours +9% at 7 days
Info
- Sample size
- n = 5,595
- Data date
- 2025
- Segment
- All segments
- Platform
- Amazon, YouTube
- Market
- Germany
Analysis
On days when German online shoppers watched at least one YouTube product review, unboxing, or haul video, their Amazon.de order rate reached 8.2% within 24 hours — compared to 7.0% on the same users' days with only non-product YouTube content. That +1.25 percentage-point absolute lift translates to an 18% relative increase, one of the clearest video-to-purchase funnel signals observed in the German e-commerce market in 2025.
The Browse-to-Buy Window Closes Fast
The lift is not permanent: at 72 hours the gap narrows to +2.0 pp (+12% relative) and by 7 days it has compressed further to +2.5 pp (+9% relative). The pattern is consistent with a short-horizon intent signal — YouTube product recommendation content accelerates a decision that was already within reach, rather than creating new long-term brand consideration. YouTube reaches 83% of German internet users and is widely used for video tutorials, reviews, and unboxings that drive purchase decisions. In Germany, where shoppers are described as careful and research-oriented, a measurable same-day Amazon.de conversion effect from YouTube product content is commercially significant. Brands and sellers investing in YouTube product recommendation videos can expect the largest measurable Amazon conversion return in the first 24 hours after a viewer watches. See how category type shapes the size of this lift in the category breakdown.
This analysis is based on public segment data. For deeper cuts, use our Enterprise interface.
Methodology
The analysis covers German online shoppers who were active on YouTube and placed at least one physical-product order on Amazon.de during 2025. Each person contributes both product-content viewing days (days with at least one product review, unboxing, or haul video) and non-product viewing days (days with only other YouTube content), creating a within-person comparison that removes differences in individual spending habits. The reported order rate is the share of viewing days on which the user placed an Amazon.de order within the stated time window (24 hours, 72 hours, or 7 days). The observation window runs from 1 January to 24 December 2025, with the final seven days excluded to ensure every order window could be fully observed.
These insights are based on the Datapods Panel. Our data comes exclusively from users who are compensated for their anonymity. Become part of the panel & earn from your data