Datapods|Insights
Consumption
Online ShoppingProduct CategoriesRetailSocial Commerce
Digital
Web & BrowsingSearch QueriesApps & MobileAdvertising
Media
Video & StreamingSocial MediaTrends & TopicsUsage Behavior
Resources|For BusinessFor Consumers
Datapods|Insights
ConsumptionOnline ShoppingProduct CategoriesRetailSocial CommerceDigitalWeb & BrowsingSearch QueriesApps & MobileAdvertisingMediaVideo & StreamingSocial MediaTrends & TopicsUsage BehaviorResourcesFor BusinessFor Consumers
InsightsConsumptionOnline Shopping
Datapods

Talk to people who actually bought your product.

Use Cases

  • Churn & Win-Back
  • Product & Concept Testing
  • Ad & Creative Testing
  • Customer Journey
  • Competitive Intelligence
  • Audiences & Segmentation
  • Influencers & Creators

Industries

  • Grocery & Drugstore
  • CPG & Brands
  • E-Commerce & Marketplaces
  • Telco & Subscriptions
  • Media & Streaming
  • Apps & Digital

Platform

  • AI Research Agent
  • AI Interviewer
  • Quant Surveys
  • Audience Builder
  • Data API
  • Social Attribution

Company

  • Home
  • About
  • For Consumers
  • The Datapods Panel
  • Insights
  • Contact
  • Resources

Legal

  • Imprint
  • Privacy Policy
  • User Agreement App
  • Privacy Policy App
  • User Agreement Platform
  • Privacy Policy Platform
  • Cookie Policy

©2026 Datapods.app. All rights reserved.

EU Co-financedNRW

Amazon Subscribe & Save vs. Non-Subscriber Repeat-Purchase Rate by Category — Germany 2025

Results as of 28.04.2026

Review Full Year 2025: Amazon Subscribe & Save users repeat at 75–82% — roughly 30 percentage points above non-subscribers in every top category
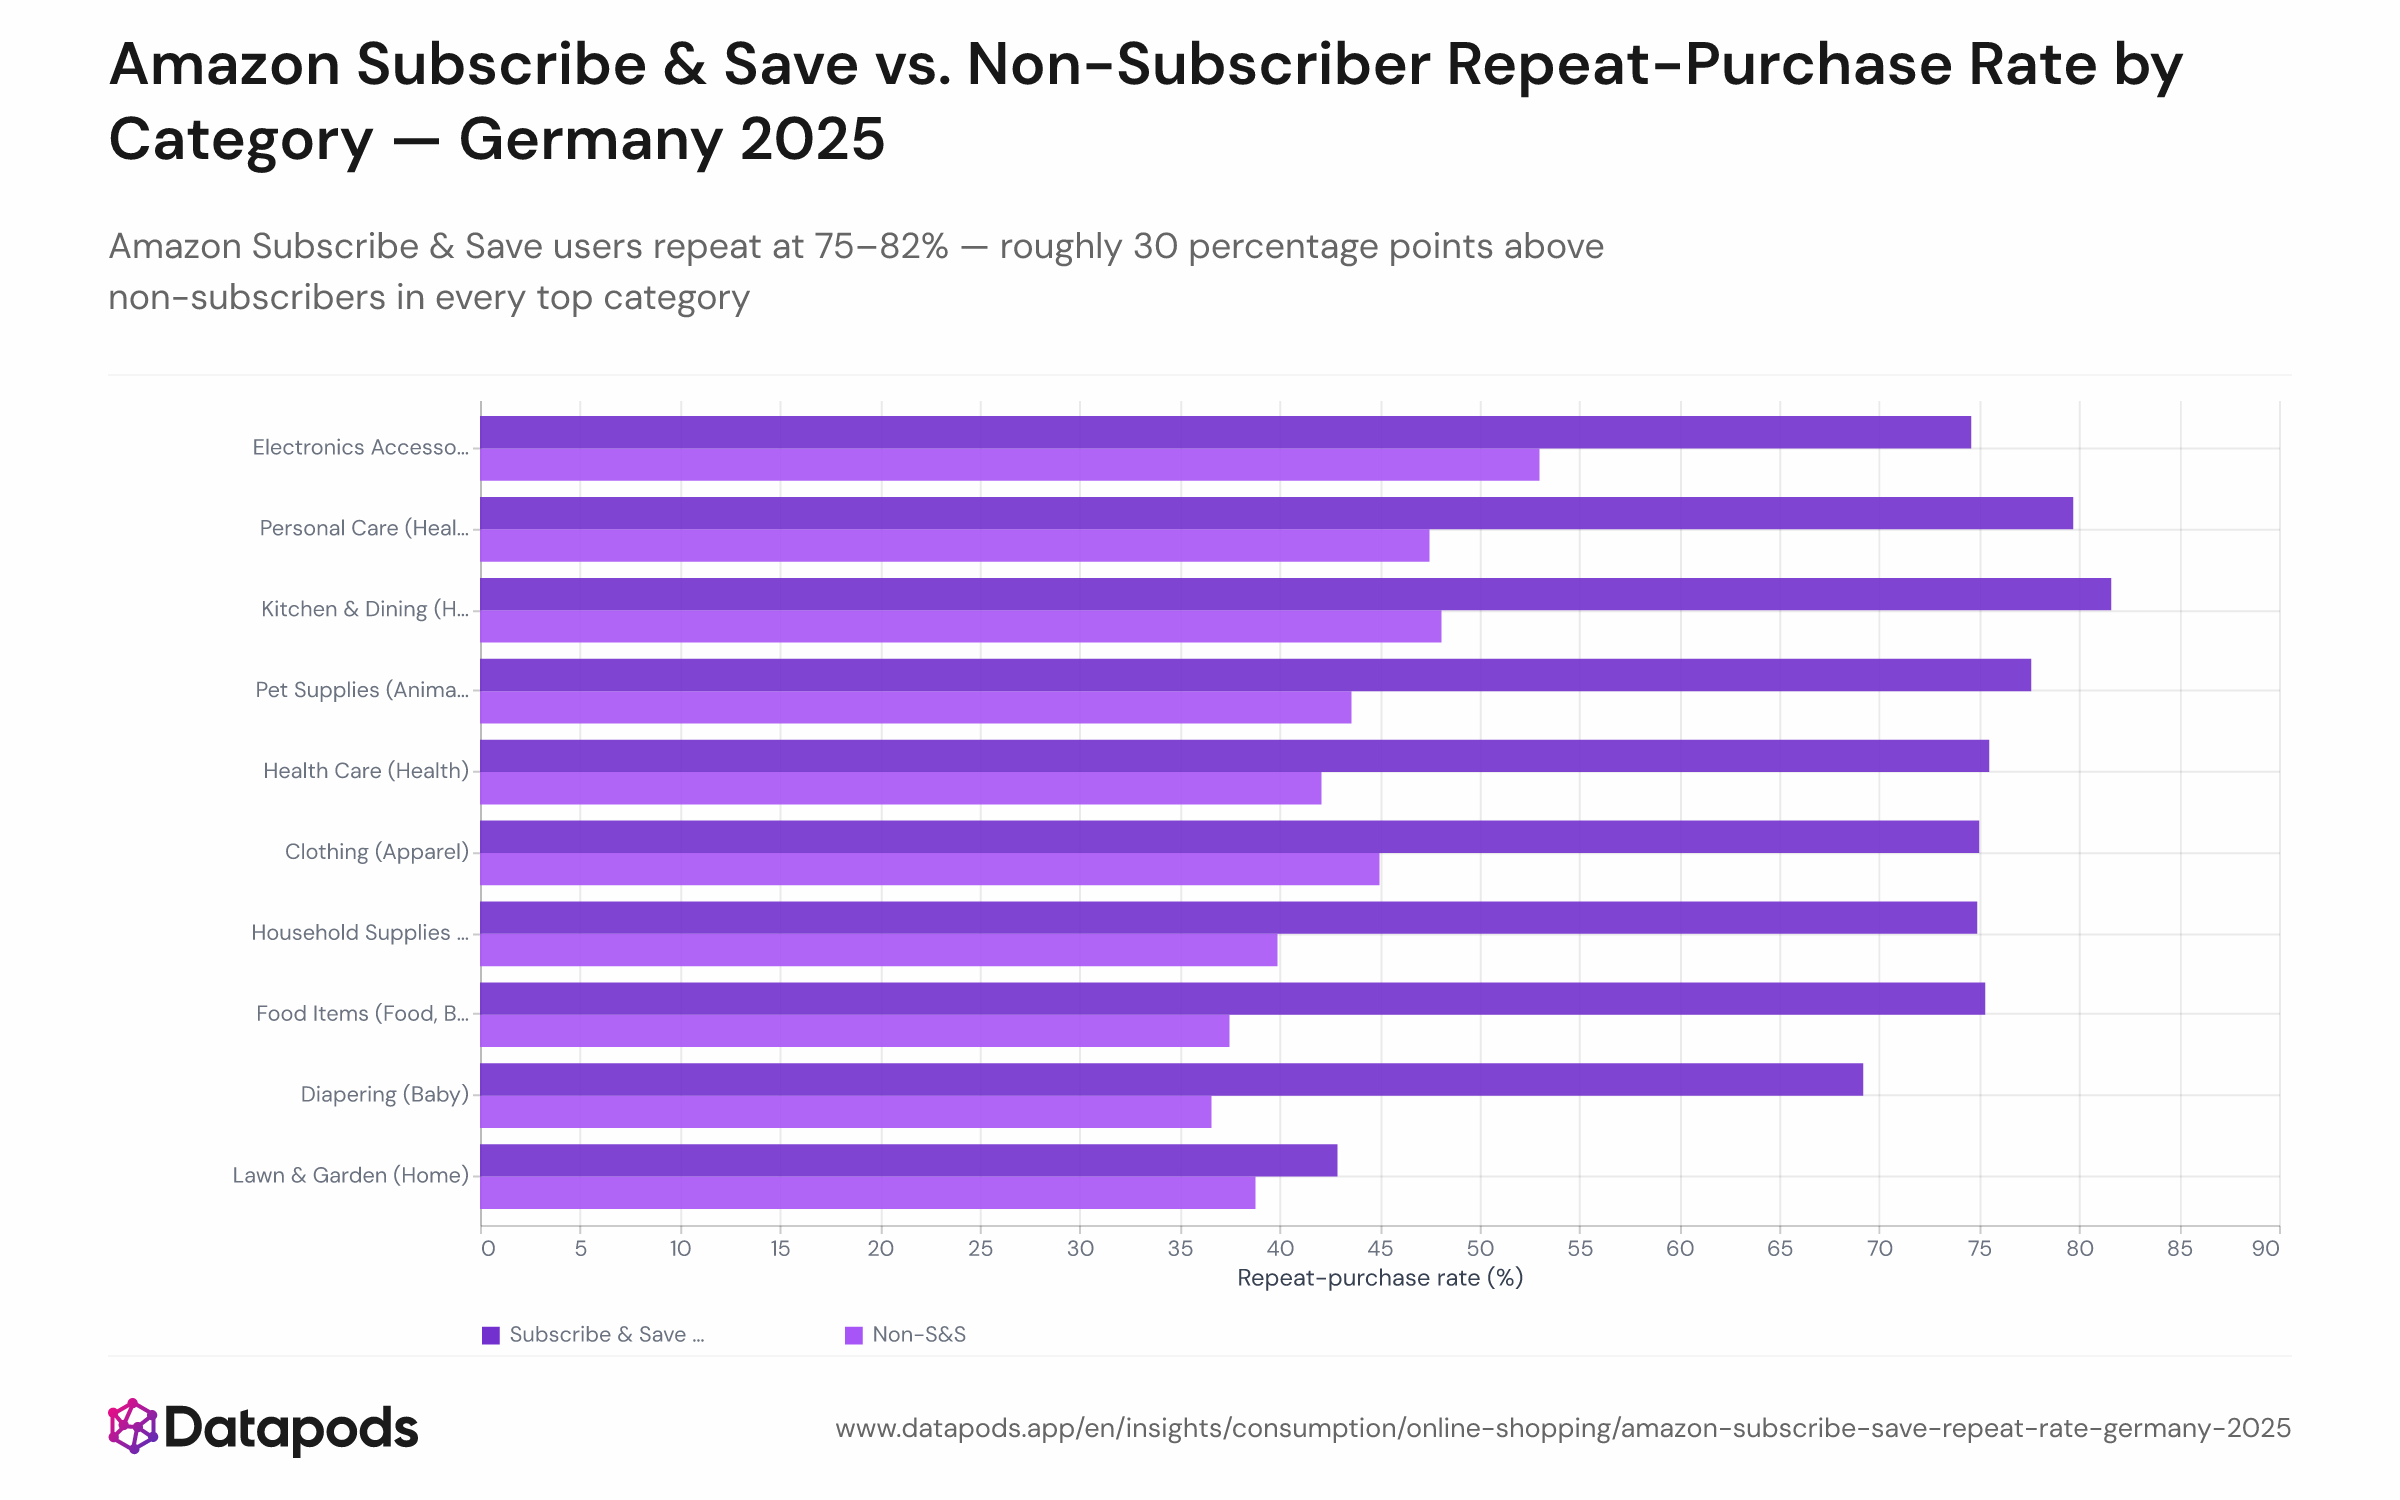
Amazon Subscribe & Save vs. Non-Subscriber Repeat-Purchase Rate by Category — Germany 2025Grouped bar chart comparing Amazon.de repeat-purchase rates in 2025 for Subscribe & Save users versus non-subscribers, broken down by the top-10 sticky product categories. S&S bars (darker) range from 75% to 82%; non-S&S bars (lighter) range from 37% to 53%. The gap between the two bars is consistently 25–35 percentage points across all consumable categories.Grouped bar chart comparing Amazon.de repeat-purchase rates in 2025 for Subscribe & Save users versus non-subscribers, broken down by the top-10 sticky product categories. S&S bars (darker) range from 75% to 82%; non-S&S bars (lighter) range from 37% to 53%. The gap between the two bars is consistently 25–35 percentage points across all consumable categories.
Grouped bar chart comparing Amazon.de repeat-purchase rates in 2025 for Subscribe & Save users versus non-subscribers, broken down by the top-10 sticky product categories. S&S bars (darker) range from 75% to 82%; non-S&S bars (lighter) range from 37% to 53%. The gap between the two bars is consistently 25–35 percentage points across all consumable categories.
Sample size
n = 27,231
Data date
Full Year 2025
Segment
All segments
Platform
Amazon
Market
Germany
Info
Sample size
n = 27,231
Data date
Full Year 2025
Segment
All segments
Platform
Amazon
Market
Germany

Analysis

Subscribe & Save enrollment produces the single largest observable lift in Amazon.de repeat-purchase behavior in 2025: subscribers repeat at 75–82% across every major consumable category, versus 37–53% for non-subscribers — a gap of 25–35 percentage points that holds consistently.

The subscription mechanic that redefines Kundenbindung on Amazon

Personal Care S&S users repeat at 80% versus 47% without a subscription; Kitchen & Dining subscribers hit 82% versus 48% for non-subscribers; Pet Supplies enrollees reach 78% against 44%. Subscribe & Save offers item discounts and the convenience of automatic deliveries, creating both a financial and a logistical lock-in that transforms occasional buyers into predictable recurring customers. The categories with the deepest S&S footprints on Amazon.de — Pet Supplies, Personal Care, Health Care, and Food Items — are precisely the ones where the subscription mechanic has the most anchoring power on Amazon Wiederholungskäufe. One notable outlier is Clothing, which ranks 6th overall for repeat rate (45%) but has near-zero S&S enrollment; its loyalty is driven entirely by category preference rather than subscription mechanics. For context on which categories carry the highest baseline repeat-purchase rates before the S&S effect, see the full category ranking.


This analysis is based on public segment data. For deeper cuts, use our Enterprise interface.

Related statistics

See all Online Shopping
  • Home & Garden: Interest-to-Purchase Gap

    H1 2026
  • Unlock deeper cuts

    Enterprise
  • Samsung Buyers: No Single Path to Purchase

    April–July 2026
  • Browsing Trends vs. Real Spend by Category

    Jul 2025 – Jun 2026
See all Online Shopping

Methodology

Buyers are classified as Subscribe & Save users if they hold any active or previously canceled S&S subscription whose product matches the same level-2 product category as the orders being analyzed. The repeat-purchase rate is then computed separately for S&S and non-S&S buyers within each top-10 category, using the same 90-day second-order window applied throughout. Cells with fewer than 5 buyers in either group are excluded. The S&S match rate across subscription records is 87%. Categories with very few S&S enrollees (notably Lawn & Garden and Clothing) carry higher variance and should be interpreted with caution.


These insights are based on the Datapods Panel. Our data comes exclusively from users who are compensated for their anonymity. Become part of the panel & earn from your data