Datapods|Insights
Consumption
Online ShoppingProduct CategoriesRetailSocial Commerce
Digital
Web & BrowsingSearch QueriesApps & MobileAdvertising
Media
Video & StreamingSocial MediaTrends & TopicsUsage Behavior
Resources|For BusinessFor Consumers
Datapods|Insights
ConsumptionOnline ShoppingProduct CategoriesRetailSocial CommerceDigitalWeb & BrowsingSearch QueriesApps & MobileAdvertisingMediaVideo & StreamingSocial MediaTrends & TopicsUsage BehaviorResourcesFor BusinessFor Consumers
InsightsConsumptionOnline Shopping
Datapods

Talk to people who actually bought your product.

Use Cases

  • Churn & Win-Back
  • Product & Concept Testing
  • Ad & Creative Testing
  • Customer Journey
  • Competitive Intelligence
  • Audiences & Segmentation
  • Influencers & Creators

Industries

  • Grocery & Drugstore
  • CPG & Brands
  • E-Commerce & Marketplaces
  • Telco & Subscriptions
  • Media & Streaming
  • Apps & Digital

Platform

  • AI Research Agent
  • AI Interviewer
  • Quant Surveys
  • Audience Builder
  • Data API
  • Social Attribution

Company

  • Home
  • About
  • For Consumers
  • The Datapods Panel
  • Insights
  • Contact
  • Resources

Legal

  • Imprint
  • Privacy Policy
  • User Agreement App
  • Privacy Policy App
  • User Agreement Platform
  • Privacy Policy Platform
  • Cookie Policy

©2026 Datapods.app. All rights reserved.

EU Co-financedNRW

Amazon Prime Day 2025 Category Mix in Germany — Electronics vs. Home & Kitchen Share Shift

Results as of 04.06.2026

Review July 2025: Electronics gained +3.6 percentage points of category share on Prime Day 2025, while Home & Kitchen lost 2.9pp
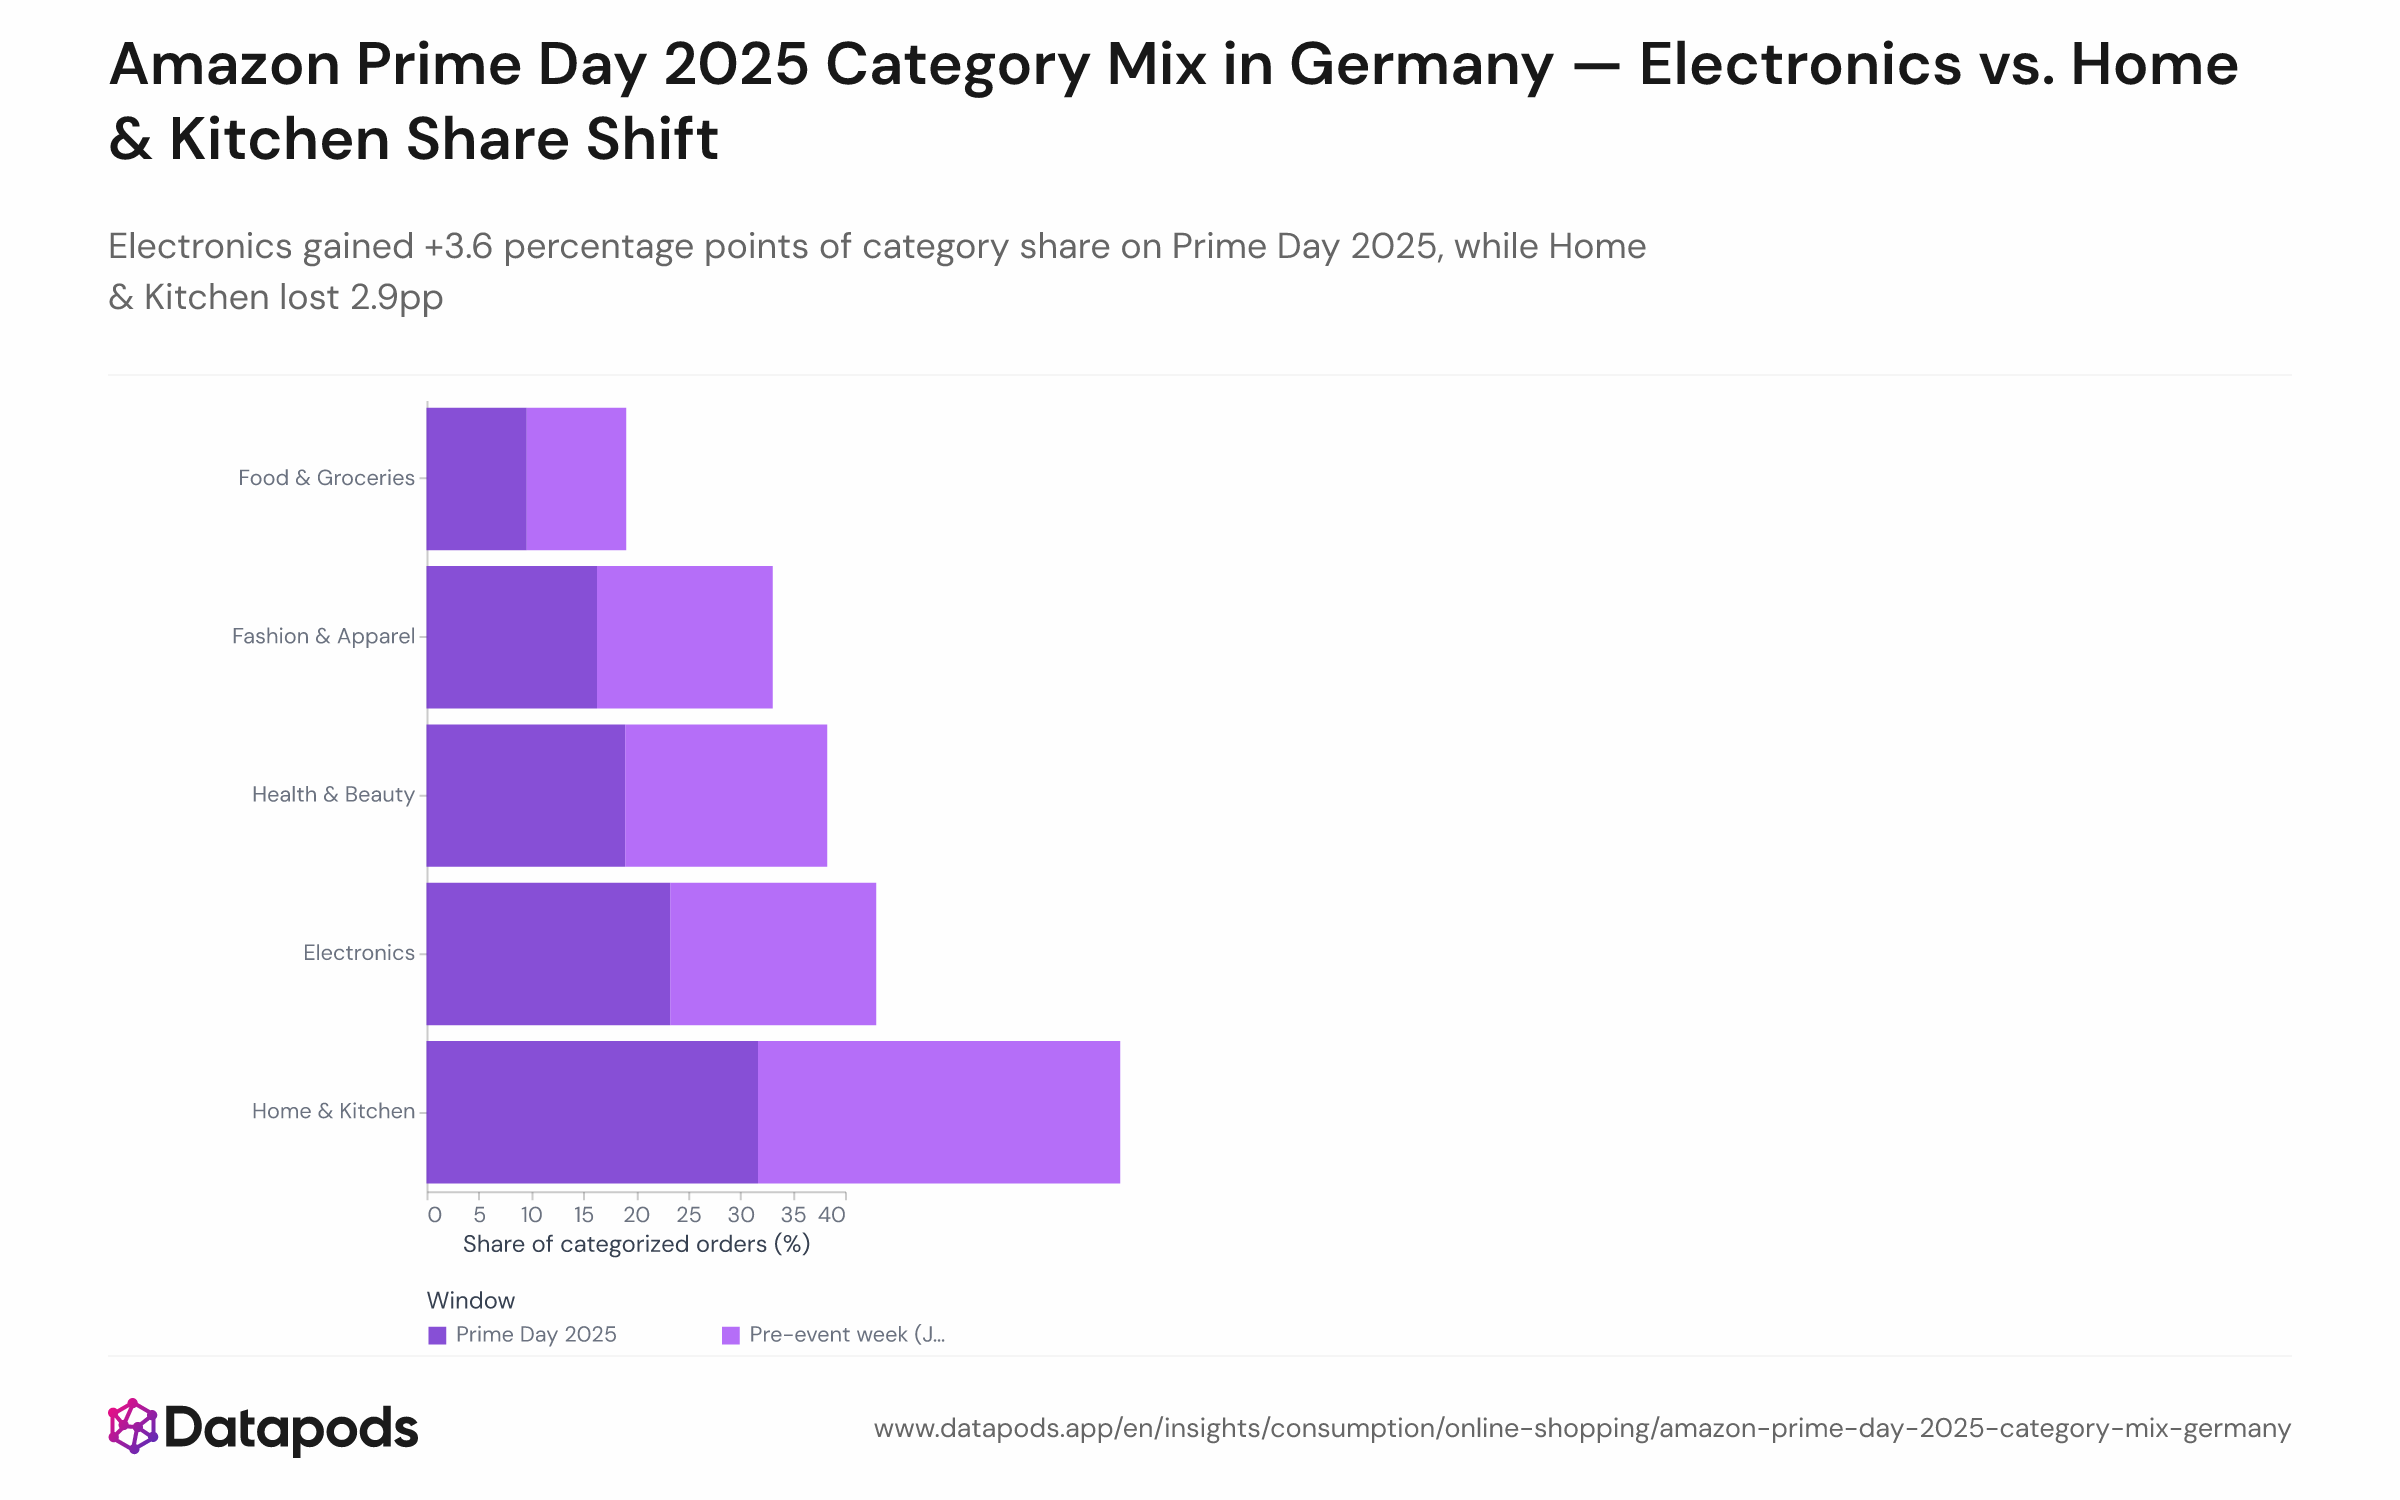
Amazon Prime Day 2025 Category Mix in Germany — Electronics vs. Home & Kitchen Share ShiftGrouped bar chart showing the category share of categorised Amazon.de orders for five product categories — Electronics, Home & Kitchen, Health & Beauty, Fashion & Apparel, and Food & Groceries — comparing the Prime Day 2025 event days (July 8–11) to the pre-event week. Electronics increases by 3.6 percentage points; Home & Kitchen decreases by 2.9 percentage points.Grouped bar chart showing the category share of categorised Amazon.de orders for five product categories — Electronics, Home & Kitchen, Health & Beauty, Fashion & Apparel, and Food & Groceries — comparing the Prime Day 2025 event days (July 8–11) to the pre-event week. Electronics increases by 3.6 percentage points; Home & Kitchen decreases by 2.9 percentage points.
Grouped bar chart showing the category share of categorised Amazon.de orders for five product categories — Electronics, Home & Kitchen, Health & Beauty, Fashion & Apparel, and Food & Groceries — comparing the Prime Day 2025 event days (July 8–11) to the pre-event week. Electronics increases by 3.6 percentage points; Home & Kitchen decreases by 2.9 percentage points.
Sample size
n = 7,673
Data date
July 2025
Segment
All segments
Platform
Purchases
Market
Germany
Info
Sample size
n = 7,673
Data date
July 2025
Segment
All segments
Platform
Purchases
Market
Germany

Analysis

Electronics was the standout winner of Amazon Prime Day 2025 in Germany, growing its share of categorised orders by 3.6 percentage points relative to the pre-event week — while Home & Kitchen, the category that typically dominates year-round, contracted by 2.9 percentage points.

Why Electronics dominates every Prime Day

Electronics consistently over-indexes on Prime Day across European markets, driven by the category's high average selling price and the tendency of consumers to defer big-ticket tech purchases until a major discount event. Across Europe in 2025, Consumer Electronics, Home & Kitchen, and Health & Beauty were the three largest revenue categories on Prime Day — but Electronics commanded the steepest discounts and the clearest intent-driven shopping behaviour. On Amazon.de, the German market's strong affinity for consumer tech amplified this effect. With Prime Day 2026 moving to June 23–26 — ahead of the FIFA World Cup — back-to-school electronics and connected home devices are expected to be prominent deal categories again. The basket value uplift seen alongside this category shift suggests that Electronics' higher price points are a key driver of Prime Day's mean order value increase.


This analysis is based on public segment data. For deeper cuts, use our Enterprise interface.

Related statistics

See all Online Shopping
  • Home & Garden: Interest-to-Purchase Gap

    H1 2026
  • Unlock deeper cuts

    Enterprise
  • Samsung Buyers: No Single Path to Purchase

    April–July 2026
  • Browsing Trends vs. Real Spend by Category

    Jul 2025 – Jun 2026
See all Online Shopping

Methodology

Category share is calculated as each category's proportion of all categorised Amazon.de orders during Prime Day 2025 (July 8–11) and the pre-event week. Categories are derived from a two-character product taxonomy covering Electronics, Home & Kitchen, Health & Beauty, Fashion & Apparel, and Food & Groceries. Shares are computed on the categorised order subset only; orders without a matched product category are excluded from the share calculation.


These insights are based on the Datapods Panel. Our data comes exclusively from users who are compensated for their anonymity. Become part of the panel & earn from your data