Datapods|Insights
Consumption
Online ShoppingProduct CategoriesRetailSocial Commerce
Digital
Web & BrowsingSearch QueriesApps & MobileAdvertising
Media
Video & StreamingSocial MediaTrends & TopicsUsage Behavior
Blog|For BusinessFor Consumers
Datapods|Insights
ConsumptionOnline ShoppingProduct CategoriesRetailSocial CommerceDigitalWeb & BrowsingSearch QueriesApps & MobileAdvertisingMediaVideo & StreamingSocial MediaTrends & TopicsUsage BehaviorBlogFor BusinessFor Consumers
InsightsConsumptionOnline Shopping
Datapods

Talk to people who actually bought your product.

Use Cases

  • Churn & Win-Back
  • Product & Concept Testing
  • Ad & Creative Testing
  • Customer Journey
  • Competitive Intelligence
  • Audiences & Segmentation
  • Influencers & Creators

Industries

  • Grocery & Drugstore
  • CPG & Brands
  • E-Commerce & Marketplaces
  • Telco & Subscriptions
  • Media & Streaming
  • Apps & Digital

Platform

  • AI Research Agent
  • AI Interviewer
  • Quant Surveys
  • Audience Builder
  • Data API
  • Social Attribution

Company

  • Home
  • About
  • For Consumers
  • The Datapods Panel
  • Insights
  • Contact
  • Blog

Legal

  • Imprint
  • Privacy Policy
  • User Agreement App
  • Privacy Policy App
  • User Agreement Platform
  • Privacy Policy Platform
  • Cookie Policy

©2026 Datapods.app. All rights reserved.

EU Co-financedNRW

Amazon Monthly Spend by Location Segment in Germany — January 2025 to March 2026

Results as of 12.05.2026

Review Jan 2025–Mar 2026: Rural and suburban Amazon shoppers in Germany spent €10–20 more per month than urban shoppers throughout 2025
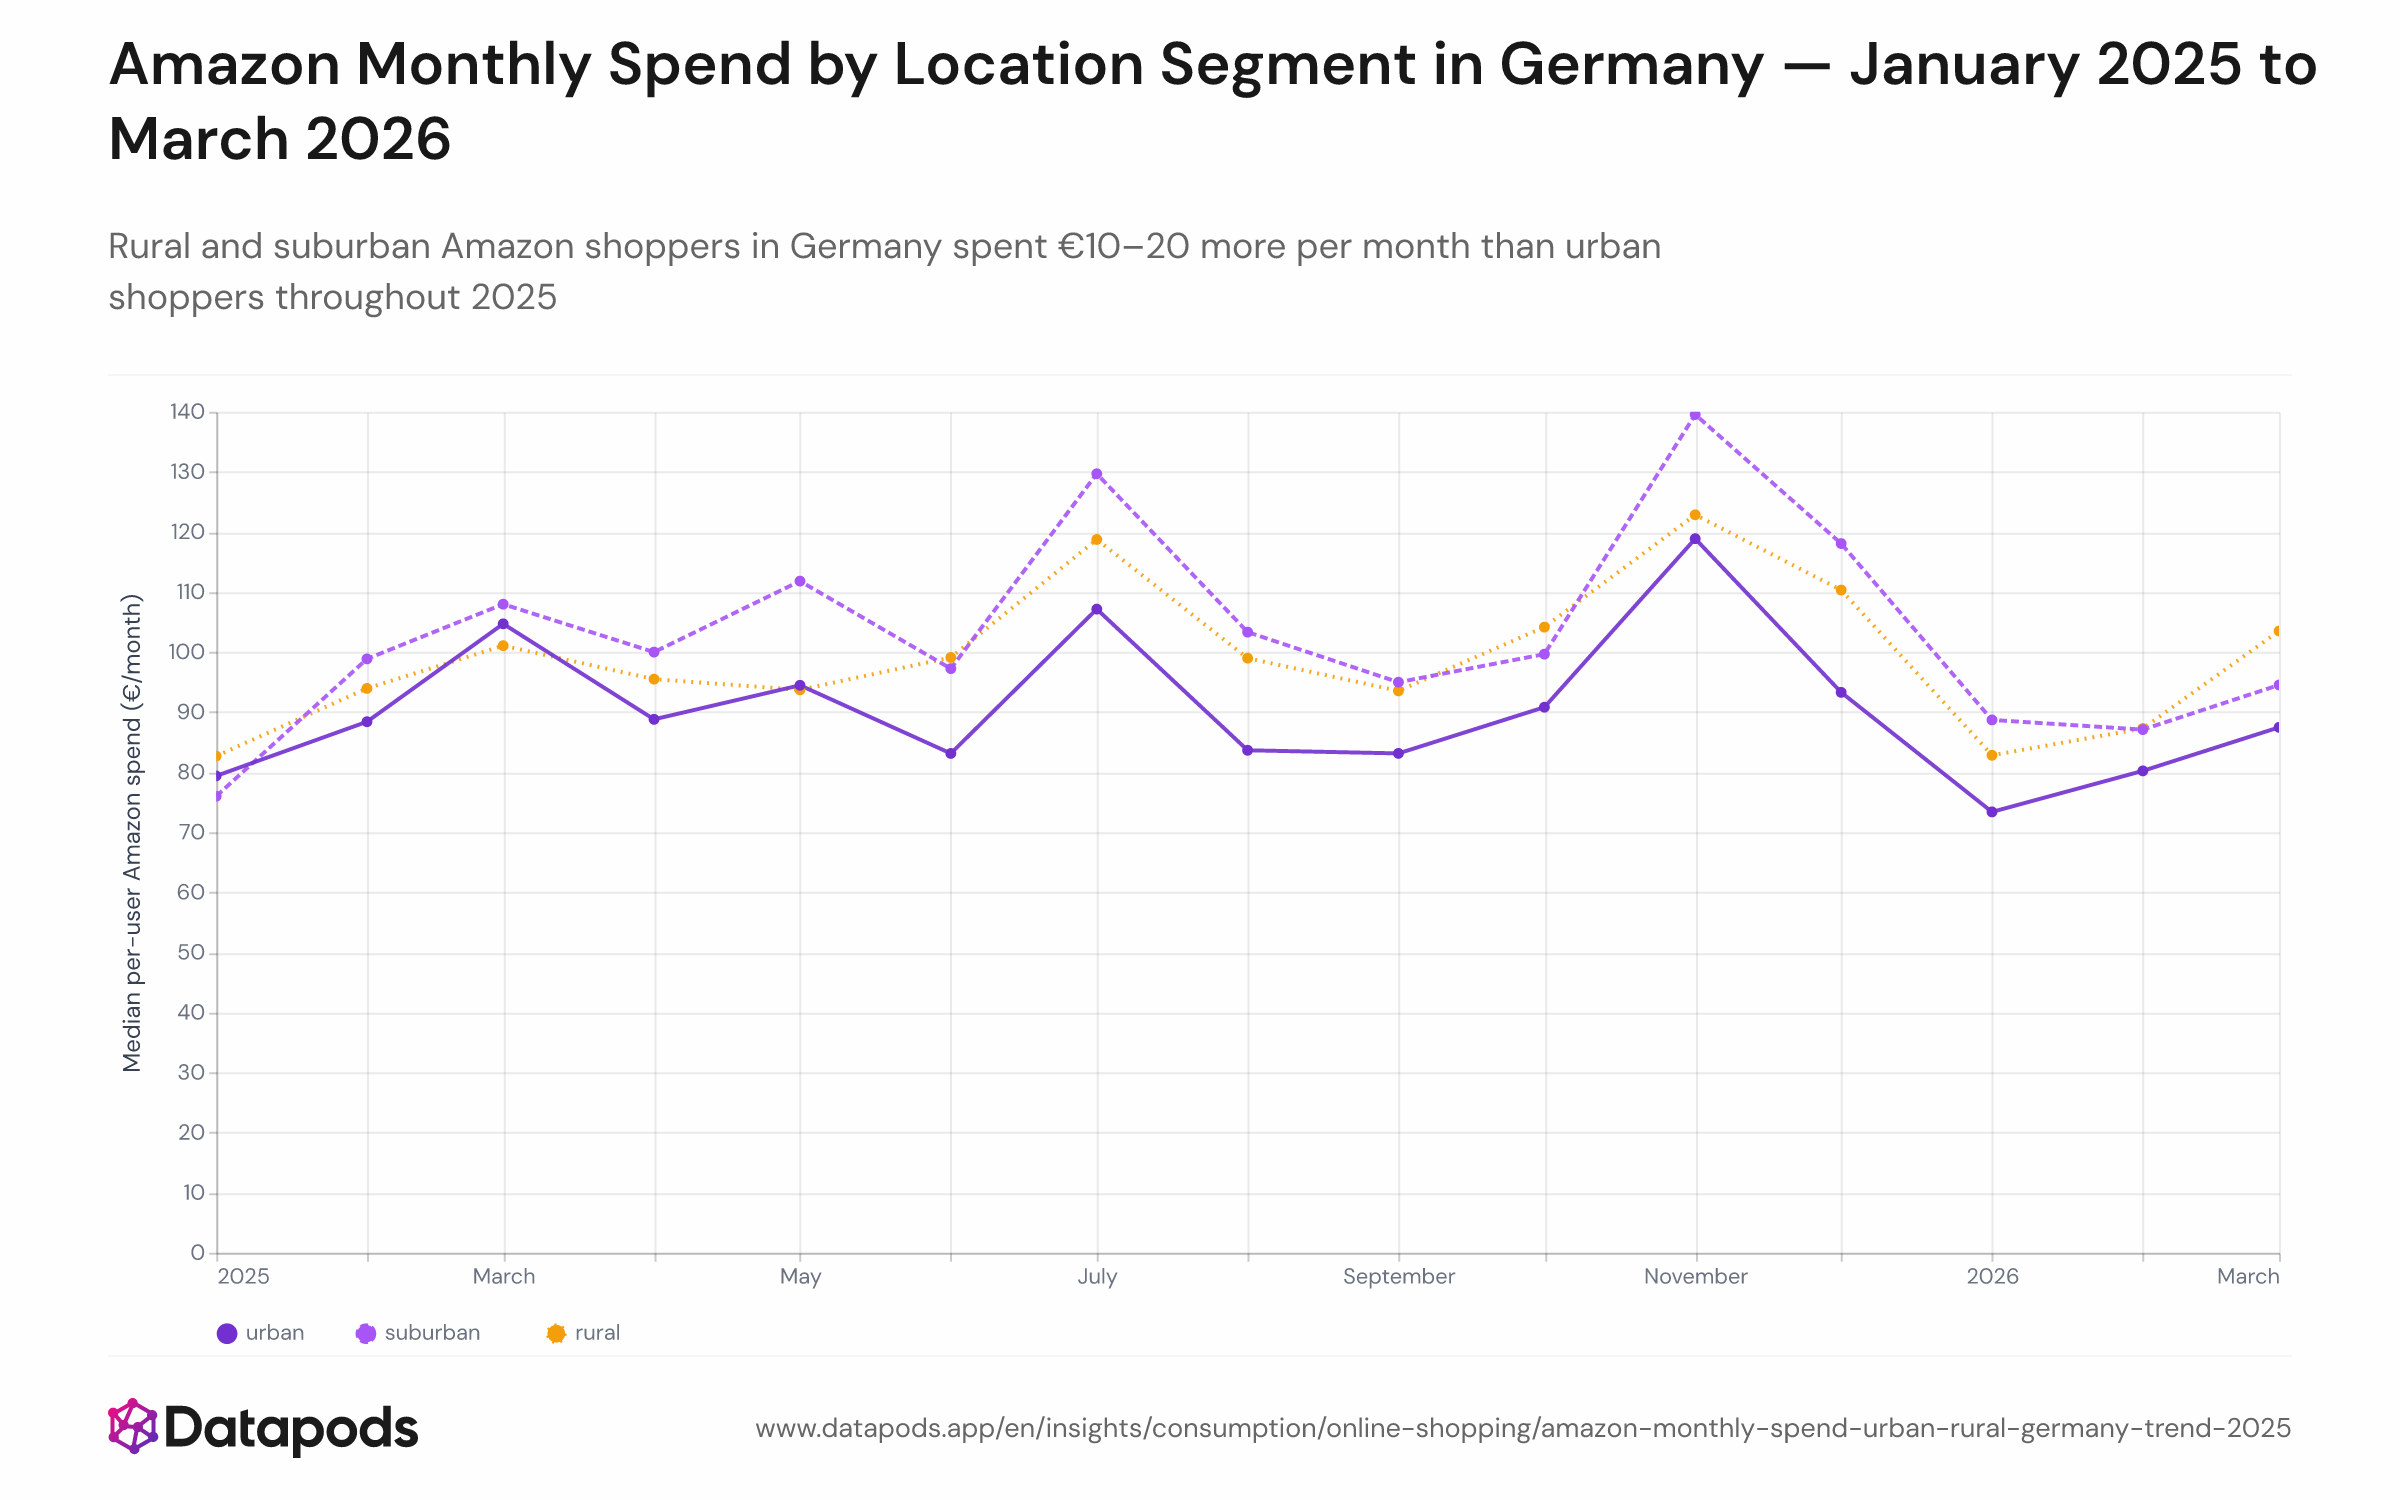
Amazon Monthly Spend by Location Segment in Germany — January 2025 to March 2026Line chart showing median monthly Amazon.de spend per active shopper by location segment — urban (blue), suburban (orange), rural (green) — from January 2025 to March 2026. All three lines peak in November 2025 (rural €123, suburban €140, urban €119) and decline through Q1 2026. Rural and suburban lines track closely together and remain above the urban line for the full period.Line chart showing median monthly Amazon.de spend per active shopper by location segment — urban (blue), suburban (orange), rural (green) — from January 2025 to March 2026. All three lines peak in November 2025 (rural €123, suburban €140, urban €119) and decline through Q1 2026. Rural and suburban lines track closely together and remain above the urban line for the full period.
Line chart showing median monthly Amazon.de spend per active shopper by location segment — urban (blue), suburban (orange), rural (green) — from January 2025 to March 2026. All three lines peak in November 2025 (rural €123, suburban €140, urban €119) and decline through Q1 2026. Rural and suburban lines track closely together and remain above the urban line for the full period.
Sample size
n = 4,011
Data date
Jan 2025–Mar 2026
Segment
All segments
Platform
Amazon, User
Market
Germany
Info
Sample size
n = 4,011
Data date
Jan 2025–Mar 2026
Segment
All segments
Platform
Amazon, User
Market
Germany

Analysis

Rural and suburban Amazon shoppers in Germany tracked within €5 of each other for most of 2025 and consistently stayed €10–20 above urban shoppers. All three location segments peaked in November 2025 — the Black Friday/Christmas ramp — before cooling roughly 10–15% through Q1 2026. The Q1 2026 slowdown is proportional across all segments, meaning no single location type is driving the dip.

A broad post-Christmas cooldown, not a regional divide

Germany's overall e-commerce market grew around 2.5% in 2025 but entered early 2026 facing a consumer spending environment shaped by persistent inflation caution and a weaker macroeconomic backdrop. The November spike — suburban shoppers peaked at €140 median monthly spend — follows the global pattern of Amazon's Black Friday event driving the year's heaviest order month. The subsequent Q1 2026 decline to €95 (suburban), €104 (rural), and €87 (urban) is a uniform post-holiday reset, not evidence of rural stagnation or urban growth. The rural-urban and suburban-urban spending gaps are examined in detail in the monthly spend gap series.


This analysis is based on public segment data. For deeper cuts, use our Enterprise interface.

Related statistics

See all Online Shopping
  • Brand Switching on Amazon.de by Category

    2024–2025
  • Amazon.de Brand-Switch Rate by Quarter

    Q1 2024 – Q4 2025
  • Unlock deeper cuts

    Enterprise
  • Amazon.de Average Order Value by Age Group — 55+ vs. 25–44 Shoppers in Germany, 2025

    Q4 2024 – Q4 2025
See all Online Shopping

Methodology

Median monthly Amazon.de spend per active shopper was calculated for each location segment — urban, suburban, and rural — for every month from January 2025 to March 2026. Only months in which a shopper placed at least one order were included in that shopper's monthly figures. Active shopper counts ranged from approximately 457 (urban, January 2025) to 1,093 (rural, December 2025) per monthly cell. Shoppers were drawn from the same 4,011-person German Amazon cohort and classified by home location relative to 43 German cities.


These insights are based on the Datapods Panel. Our data comes exclusively from users who are compensated for their anonymity. Become part of the panel & earn from your data