
Cooling Appliance Buyer Rate Up 467% in Heatwave
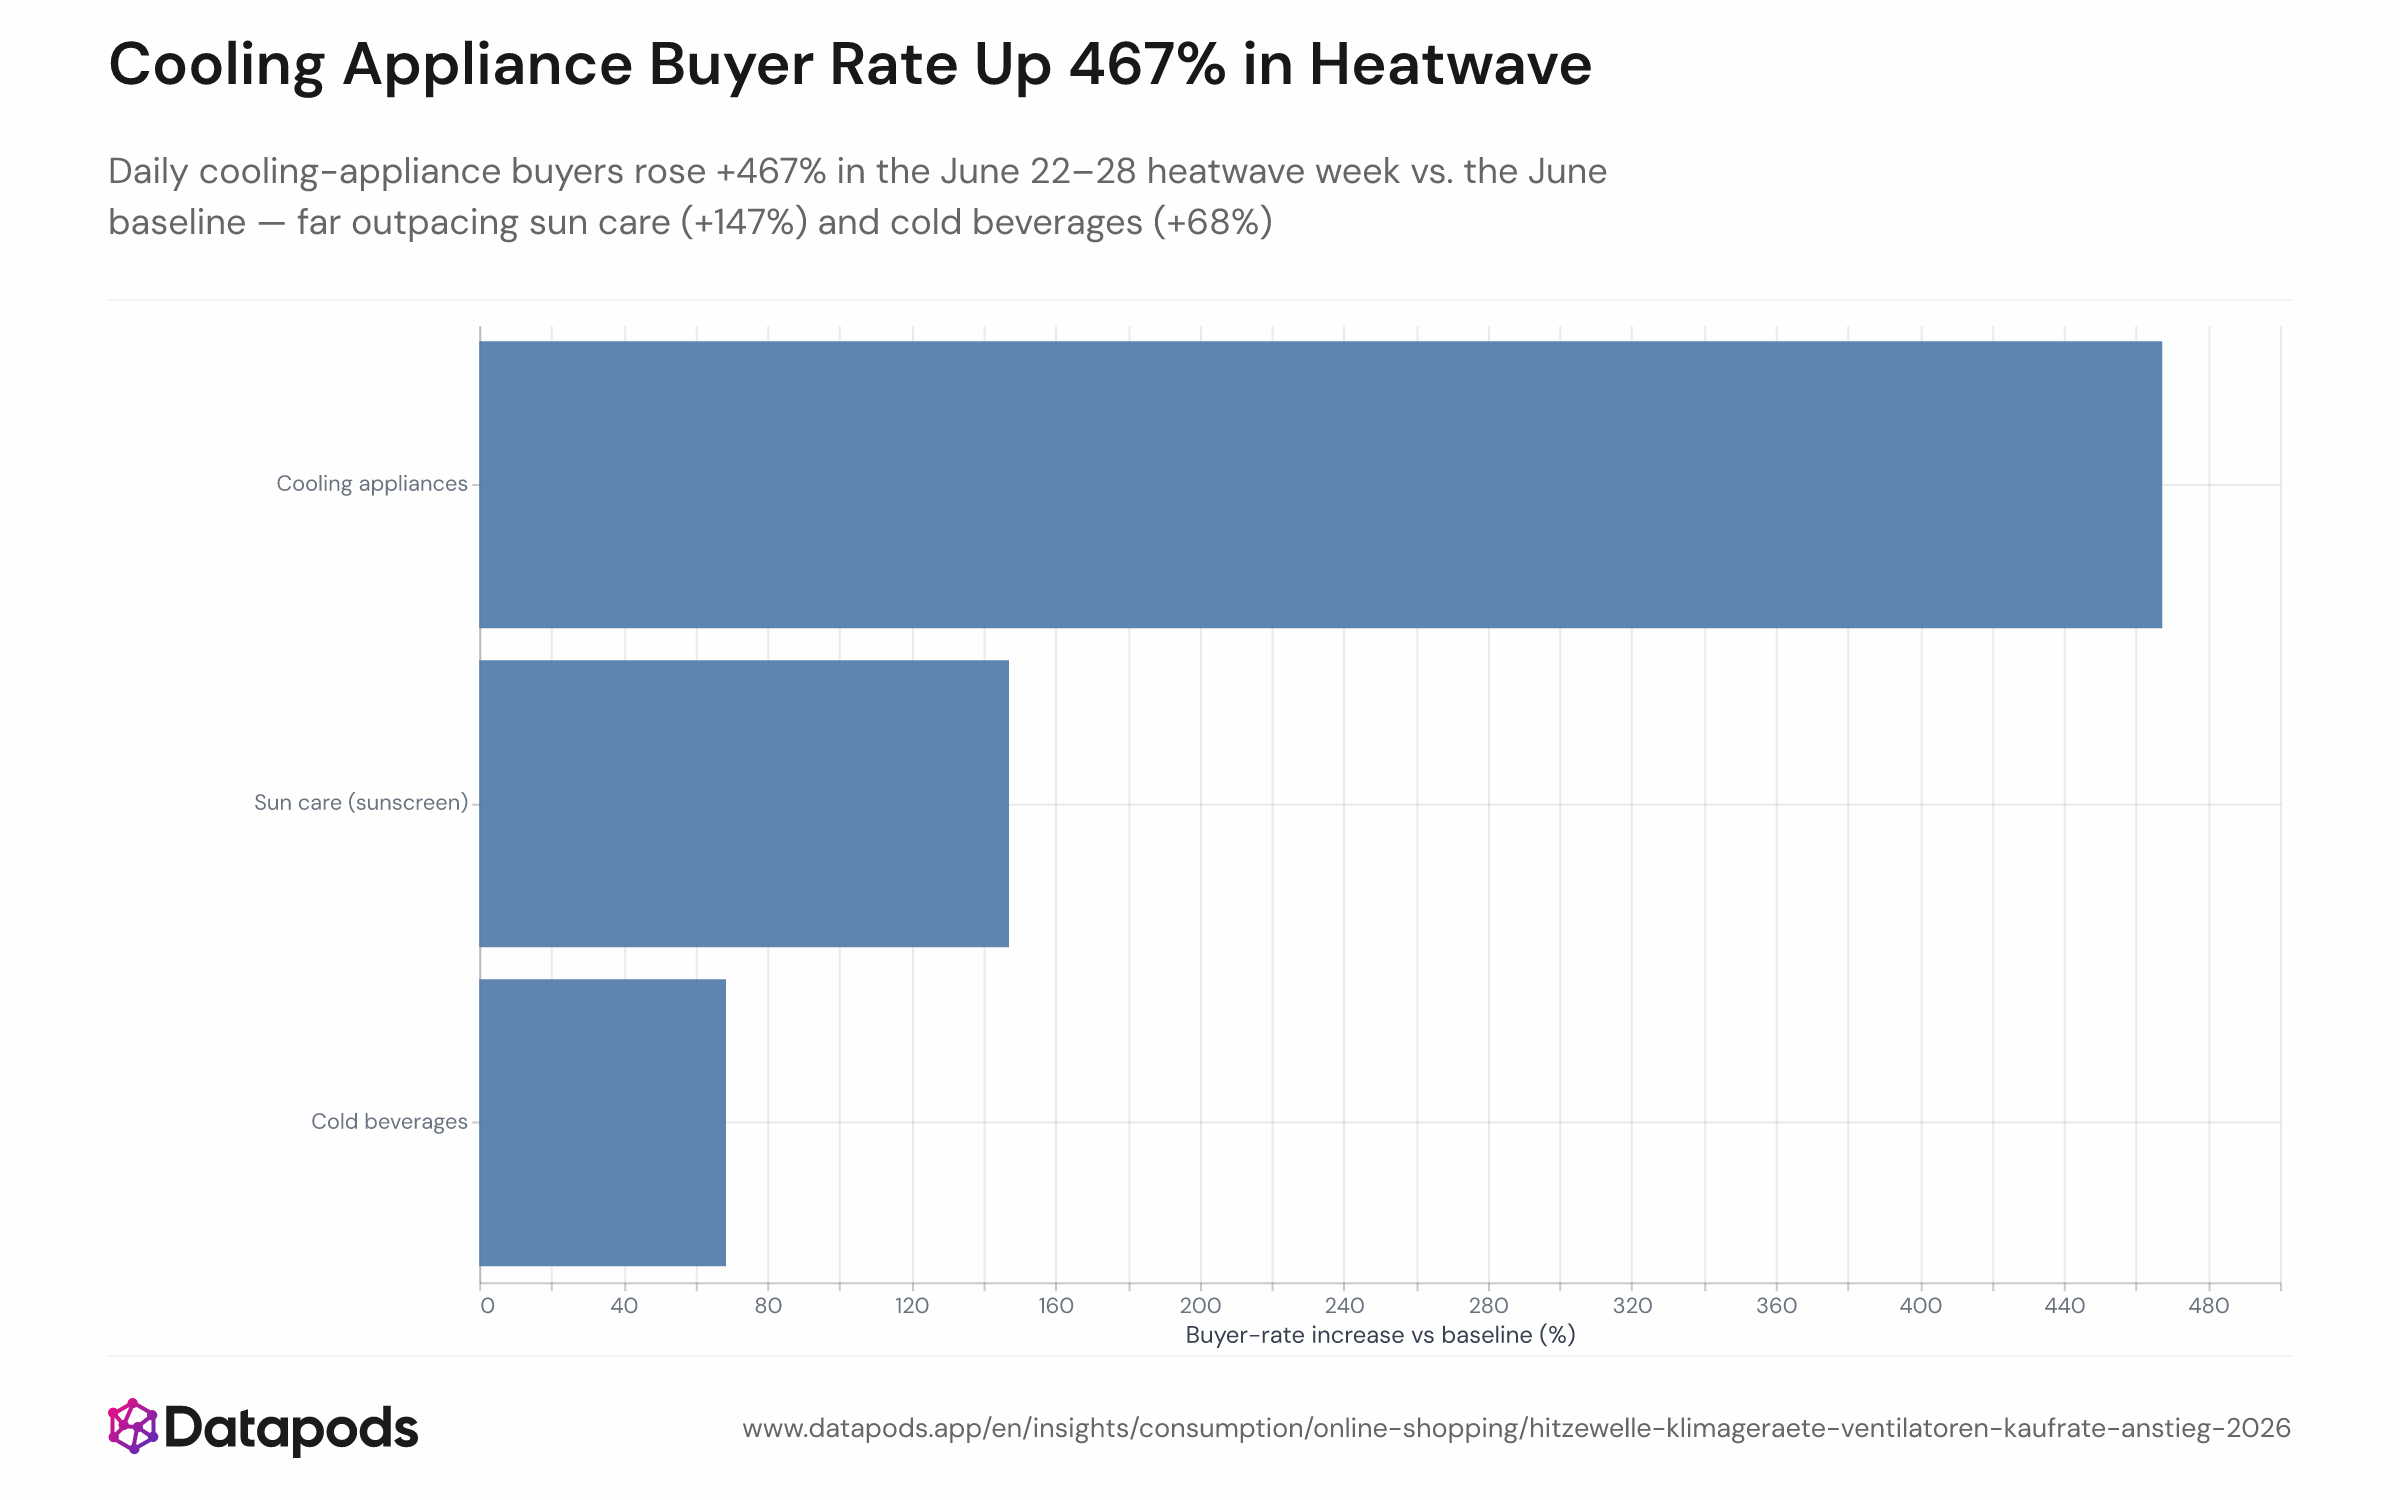
Review June 2026: Daily cooling-appliance buyers rose +467% in the June 22–28 heatwave week vs. the June baseline — far outpacing sun care (+147%) and cold beverages (+68%)
Info
- Sample size
- n = 944
- Data date
- June 2026
- Segment
- All segments
- Platform
- Purchases
- Market
- Germany
Analysis
Of the three heat-relevant categories tracked, cooling appliances — fans, air conditioners, and evaporative coolers — registered by far the most explosive response to Germany's record June 2026 heatwave, with the daily buyer rate jumping from roughly 10.5 to 59.4 per day. Sun care and cold beverages also accelerated, but neither came close to the category-level intensity seen in hardware.
Sommerkauf Klimaanlage: Ausverkauf trifft auf Rekordnachfrage
The online surge tracked here unfolded against a backdrop of near-total sell-outs in physical retail. Chinese brands' share of the European AC market had already climbed to 41% in the 2025 cooling season, and the June 2026 event accelerated that trend dramatically: JD.com's European platform saw air-conditioner sales surge roughly 40 times during the June 19–25 peak versus the first week of the month. Fan exports from China to Germany had already risen around 60% year-on-year in the January–May period before the heatwave struck. The +68% uplift in cold-beverage buying — while more modest — points to a secondary retail shift that bricks-and-mortar grocery likely also captured, unlike the cooling-hardware market which funnelled almost entirely through online channels.
This analysis is based on public segment data. For deeper cuts, use our Enterprise interface.
Methodology
Daily buyer rate for each sub-category was calculated by dividing the total number of distinct buyers in a period by the number of days in that period: 7 days for the peak heatwave week (June 22–28) and 21 days for the June 1–21 baseline. This day-rate approach ensures the two periods — which differ in length — are directly comparable. Sub-categories covered: cooling appliances (fans, air conditioners, evaporative coolers), sun care (sunscreen and UV protection), and cold beverages. Growth percentages express the change in the daily buyer rate from baseline to peak week.