Datapods|Insights
Consumption
Online ShoppingProduct CategoriesRetailSocial Commerce
Digital
Web & BrowsingSearch QueriesApps & MobileAdvertising
Media
Video & StreamingSocial MediaTrends & TopicsUsage Behavior
Blog|For BusinessFor Consumers
Datapods|Insights
ConsumptionOnline ShoppingProduct CategoriesRetailSocial CommerceDigitalWeb & BrowsingSearch QueriesApps & MobileAdvertisingMediaVideo & StreamingSocial MediaTrends & TopicsUsage BehaviorBlogFor BusinessFor Consumers
InsightsDigitalSearch Queries
Datapods

Talk to people who actually bought your product.

Use Cases

  • Churn & Win-Back
  • Product & Concept Testing
  • Ad & Creative Testing
  • Customer Journey
  • Competitive Intelligence
  • Audiences & Segmentation
  • Influencers & Creators

Industries

  • Grocery & Drugstore
  • CPG & Brands
  • E-Commerce & Marketplaces
  • Telco & Subscriptions
  • Media & Streaming
  • Apps & Digital

Platform

  • AI Research Agent
  • AI Interviewer
  • Quant Surveys
  • Audience Builder
  • Data API
  • Social Attribution

Company

  • Home
  • About
  • For Consumers
  • The Datapods Panel
  • Insights
  • Contact
  • Blog

Legal

  • Imprint
  • Privacy Policy
  • User Agreement App
  • Privacy Policy App
  • User Agreement Platform
  • Privacy Policy Platform
  • Cookie Policy

©2026 Datapods.app. All rights reserved.

EU Co-financedNRW

TikTok vs. Google: Search Intensity per User

Results as of 13.07.2026

Review Oct 2025–Jun 2026: TikTok search intensity among German users surged +57% to 81 queries/user/month as Google product-search intensity fell −47% to 10 queries/user/month Oct 2025–Jun 2026
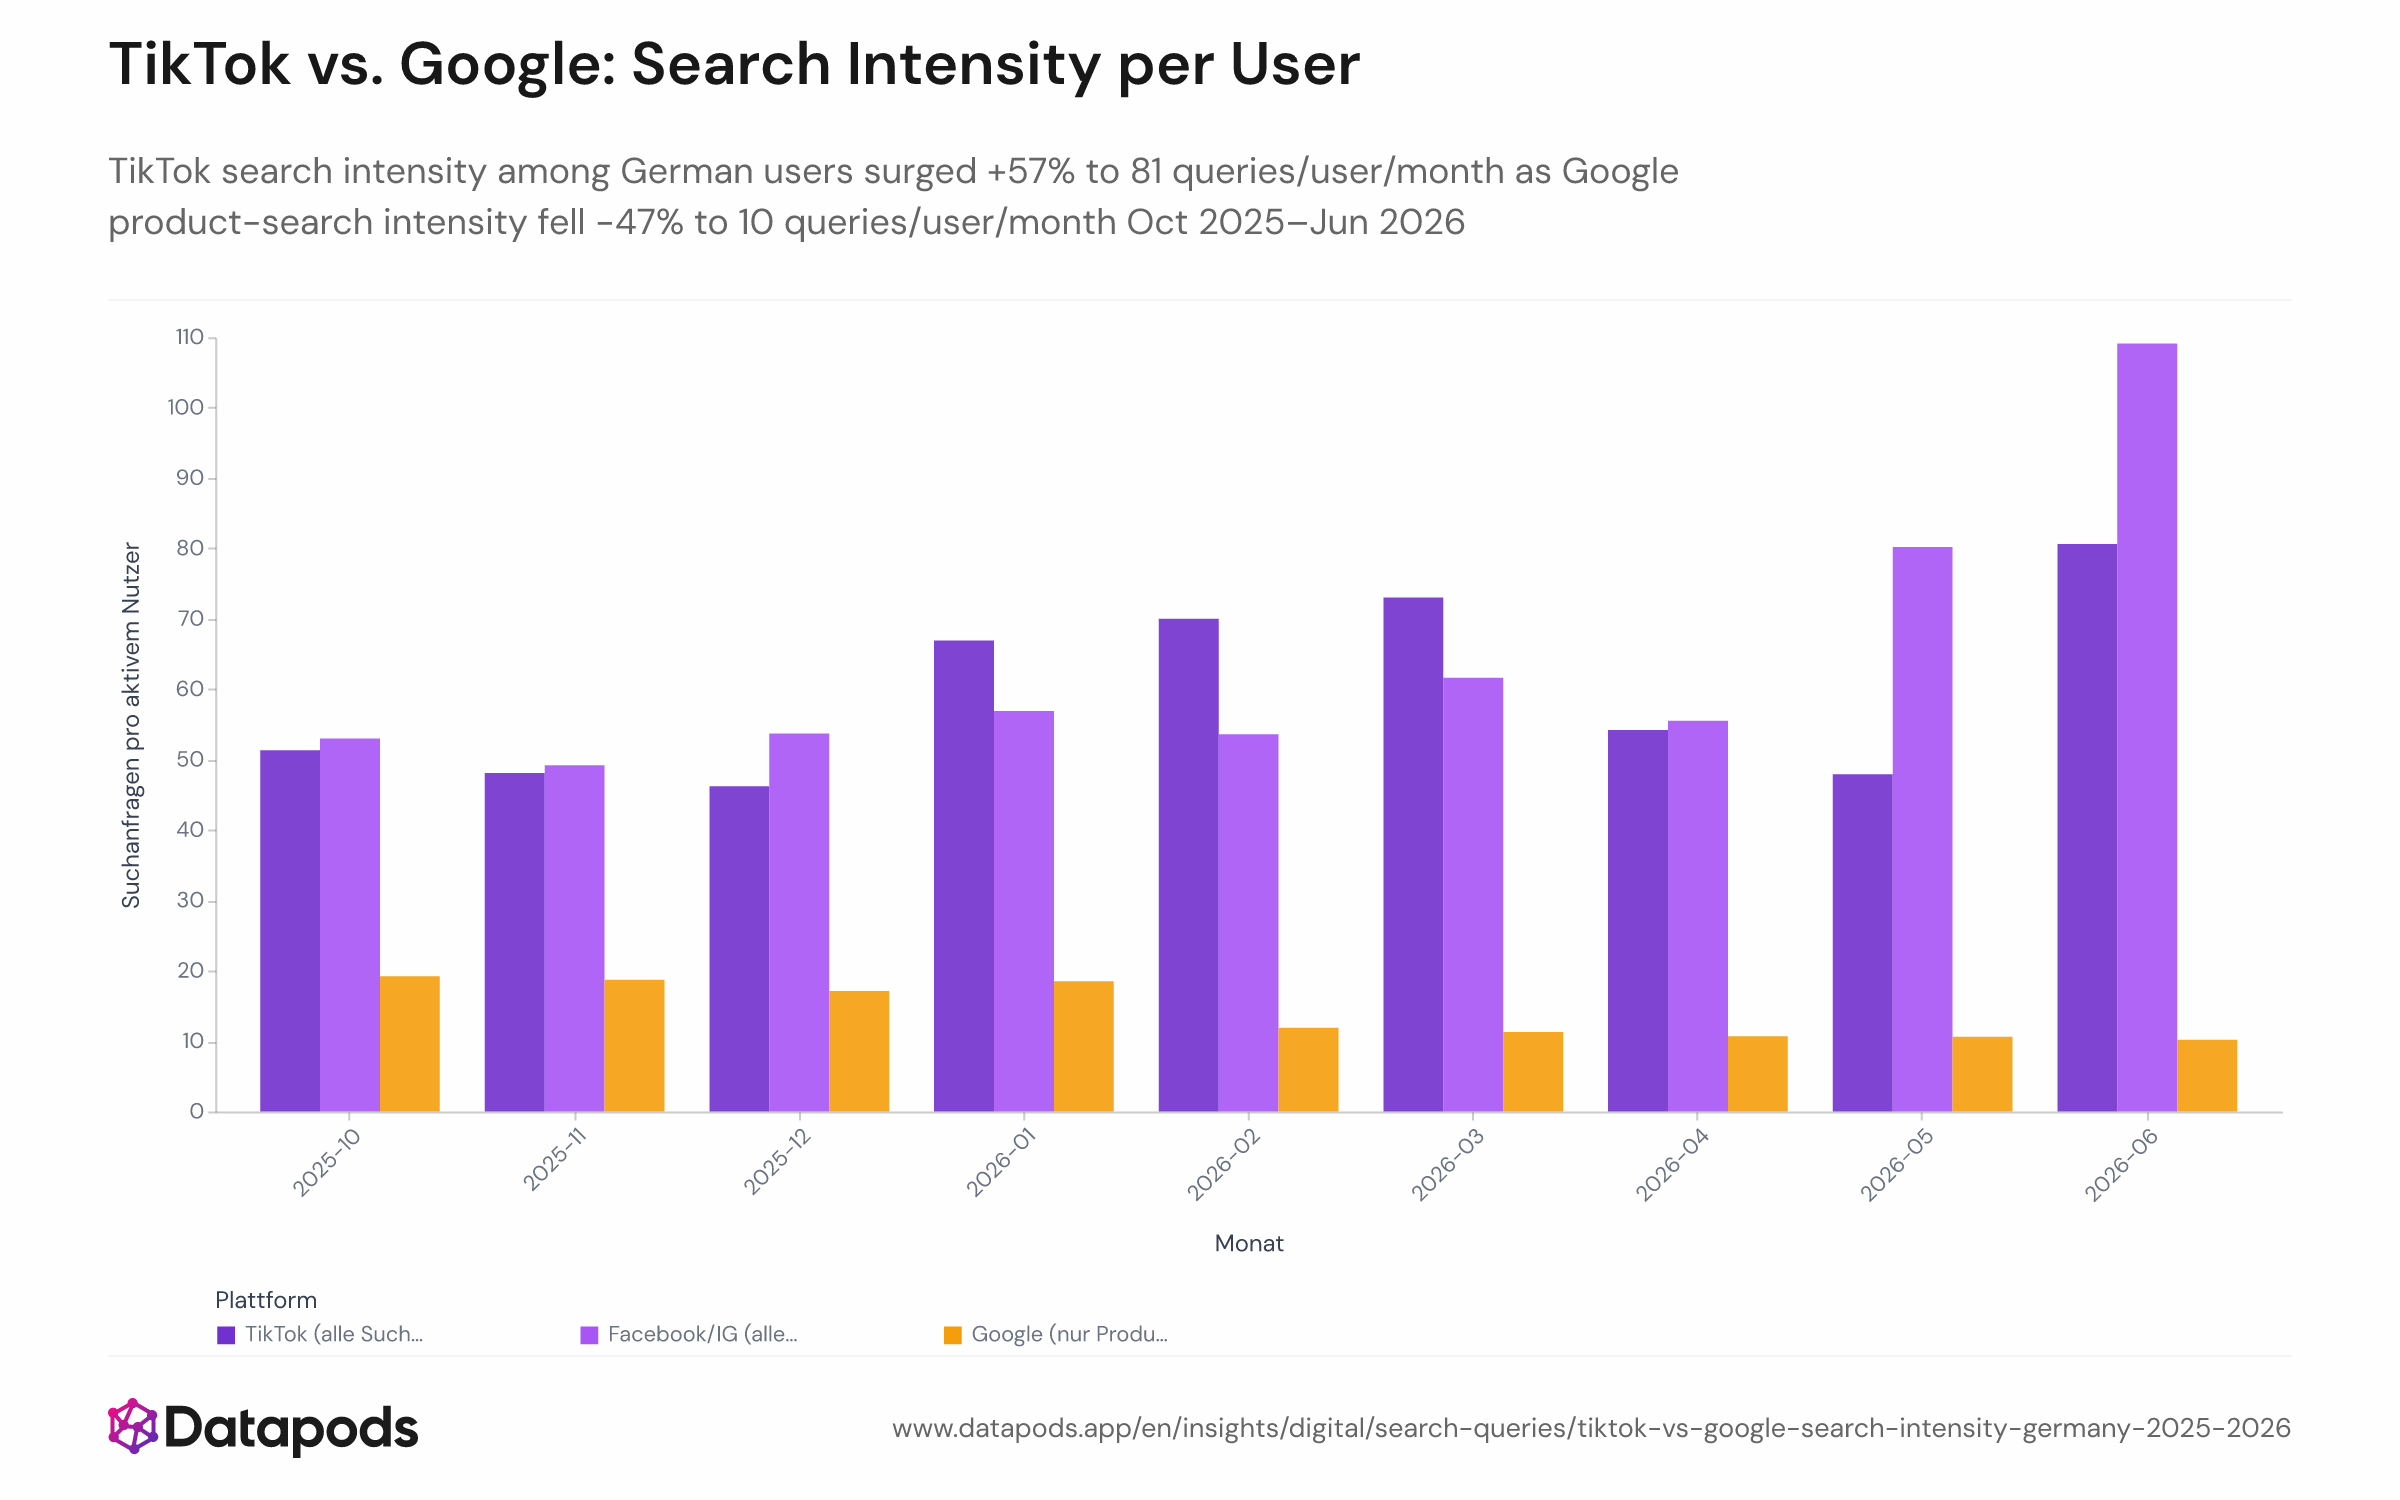
TikTok vs. Google: Search Intensity per UserLine chart showing monthly search intensity (queries per active user per month) for TikTok and Google product searches among German users from October 2025 to June 2026. TikTok's line rises from 51 to 81 queries per user per month (+57%), while Google's product-search line falls from 19 to 10 queries per user per month (−47%). A third line for Facebook/Instagram is also shown, rising steeply from May 2026 onward.Line chart showing monthly search intensity (queries per active user per month) for TikTok and Google product searches among German users from October 2025 to June 2026. TikTok's line rises from 51 to 81 queries per user per month (+57%), while Google's product-search line falls from 19 to 10 queries per user per month (−47%). A third line for Facebook/Instagram is also shown, rising steeply from May 2026 onward.
Line chart showing monthly search intensity (queries per active user per month) for TikTok and Google product searches among German users from October 2025 to June 2026. TikTok's line rises from 51 to 81 queries per user per month (+57%), while Google's product-search line falls from 19 to 10 queries per user per month (−47%). A third line for Facebook/Instagram is also shown, rising steeply from May 2026 onward.
Sample size
n = 13,647
Data date
Oct 2025–Jun 2026
Segment
All segments
Platform
Fb, Search, TikTok
Market
Germany
Info
Sample size
n = 13,647
Data date
Oct 2025–Jun 2026
Segment
All segments
Platform
Fb, Search, TikTok
Market
Germany

Analysis

TikTok's search intensity among active German users nearly doubled from 51 to 81 queries per user per month between October 2025 and June 2026 — while Google's product-search intensity collapsed from 19 to just 10 queries per user per month over the same window. The gap between the two trajectories is one of the sharpest behavioural divergences in recent German digital data.

TikTok Shop's German launch as an accelerant

The March 2025 launch of TikTok Shop in Germany, backed by brands including ABOUT YOU and NIVEA, created a direct commercial incentive for users to search inside the app rather than leave it for a browser. Since then, TikTok Shop GMV in key European markets has recorded triple-digit daily growth between August 2025 and February 2026. As product listings, shoppable videos, and a native Shop Tab embed commercial intent deeper into TikTok's interface, each new feature raises the ceiling on in-app search volume. Google's loss, meanwhile, is concentrated in commercial and transactional queries — exactly the high-intent moments that carry the most value for advertisers and brands. Informational searches on Google remain near-unchanged, which suggests users are not abandoning Google wholesale, but increasingly routing product-comparison and purchase-intent queries through social platforms instead.


This analysis is based on public segment data. For deeper cuts, use our Enterprise interface.

Related statistics

See all Search Queries
  • BYD vs. Tesla & VW Search Click-Through Destinations in Germany — 2025–2026

    Jan 2025 – Jun 2026
  • Unlock deeper cuts

    Enterprise
  • BYD Search Interest by Age Group in Germany — 2025–2026

    Jan 2025 – Jun 2026
  • AI Tool Share in German Google Product Searches: ChatGPT, Gemini, Perplexity — 2025 to Q1 2026

    2025 – Q1 2026
See all Search Queries

Methodology

Search intensity is measured as the total number of search queries divided by the number of active searchers in a given month, tracked among German online users from October 2025 to June 2026. TikTok figures cover all search queries entered in the TikTok app. Google figures cover only commercial and transactional queries linked to a product category — general informational searches are excluded. The two metrics are therefore not directly comparable in absolute volume, but each independently tracks how intensively users engage with search on its respective platform.


These insights are based on the Datapods Panel. Our data comes exclusively from users who are compensated for their anonymity. Become part of the panel & earn from your data