Datapods|Insights
Consumption
Online ShoppingProduct CategoriesRetailSocial Commerce
Digital
Web & BrowsingSearch QueriesApps & MobileAdvertising
Media
Video & StreamingSocial MediaTrends & TopicsUsage Behavior
Blog|For BusinessFor Consumers
Datapods|Insights
ConsumptionOnline ShoppingProduct CategoriesRetailSocial CommerceDigitalWeb & BrowsingSearch QueriesApps & MobileAdvertisingMediaVideo & StreamingSocial MediaTrends & TopicsUsage BehaviorBlogFor BusinessFor Consumers
InsightsConsumptionOnline Shopping
Datapods

Talk to people who actually bought your product.

Use Cases

  • Churn & Win-Back
  • Product & Concept Testing
  • Ad & Creative Testing
  • Customer Journey
  • Competitive Intelligence
  • Audiences & Segmentation
  • Influencers & Creators

Industries

  • Grocery & Drugstore
  • CPG & Brands
  • E-Commerce & Marketplaces
  • Telco & Subscriptions
  • Media & Streaming
  • Apps & Digital

Platform

  • AI Research Agent
  • AI Interviewer
  • Quant Surveys
  • Audience Builder
  • Data API
  • Social Attribution

Company

  • Home
  • About
  • For Consumers
  • The Datapods Panel
  • Insights
  • Contact
  • Blog

Legal

  • Imprint
  • Privacy Policy
  • User Agreement App
  • Privacy Policy App
  • User Agreement Platform
  • Privacy Policy Platform
  • Cookie Policy

©2026 Datapods.app. All rights reserved.

EU Co-financedNRW

Brand Switching on Amazon.de by Category

Results as of 10.07.2026

Review 2024–2025: Personal-care buyers on Amazon.de switched their dominant brand in 74.8% of cases in 2024→2025 — more than twice the rate seen in coffee/tea at 35.7%
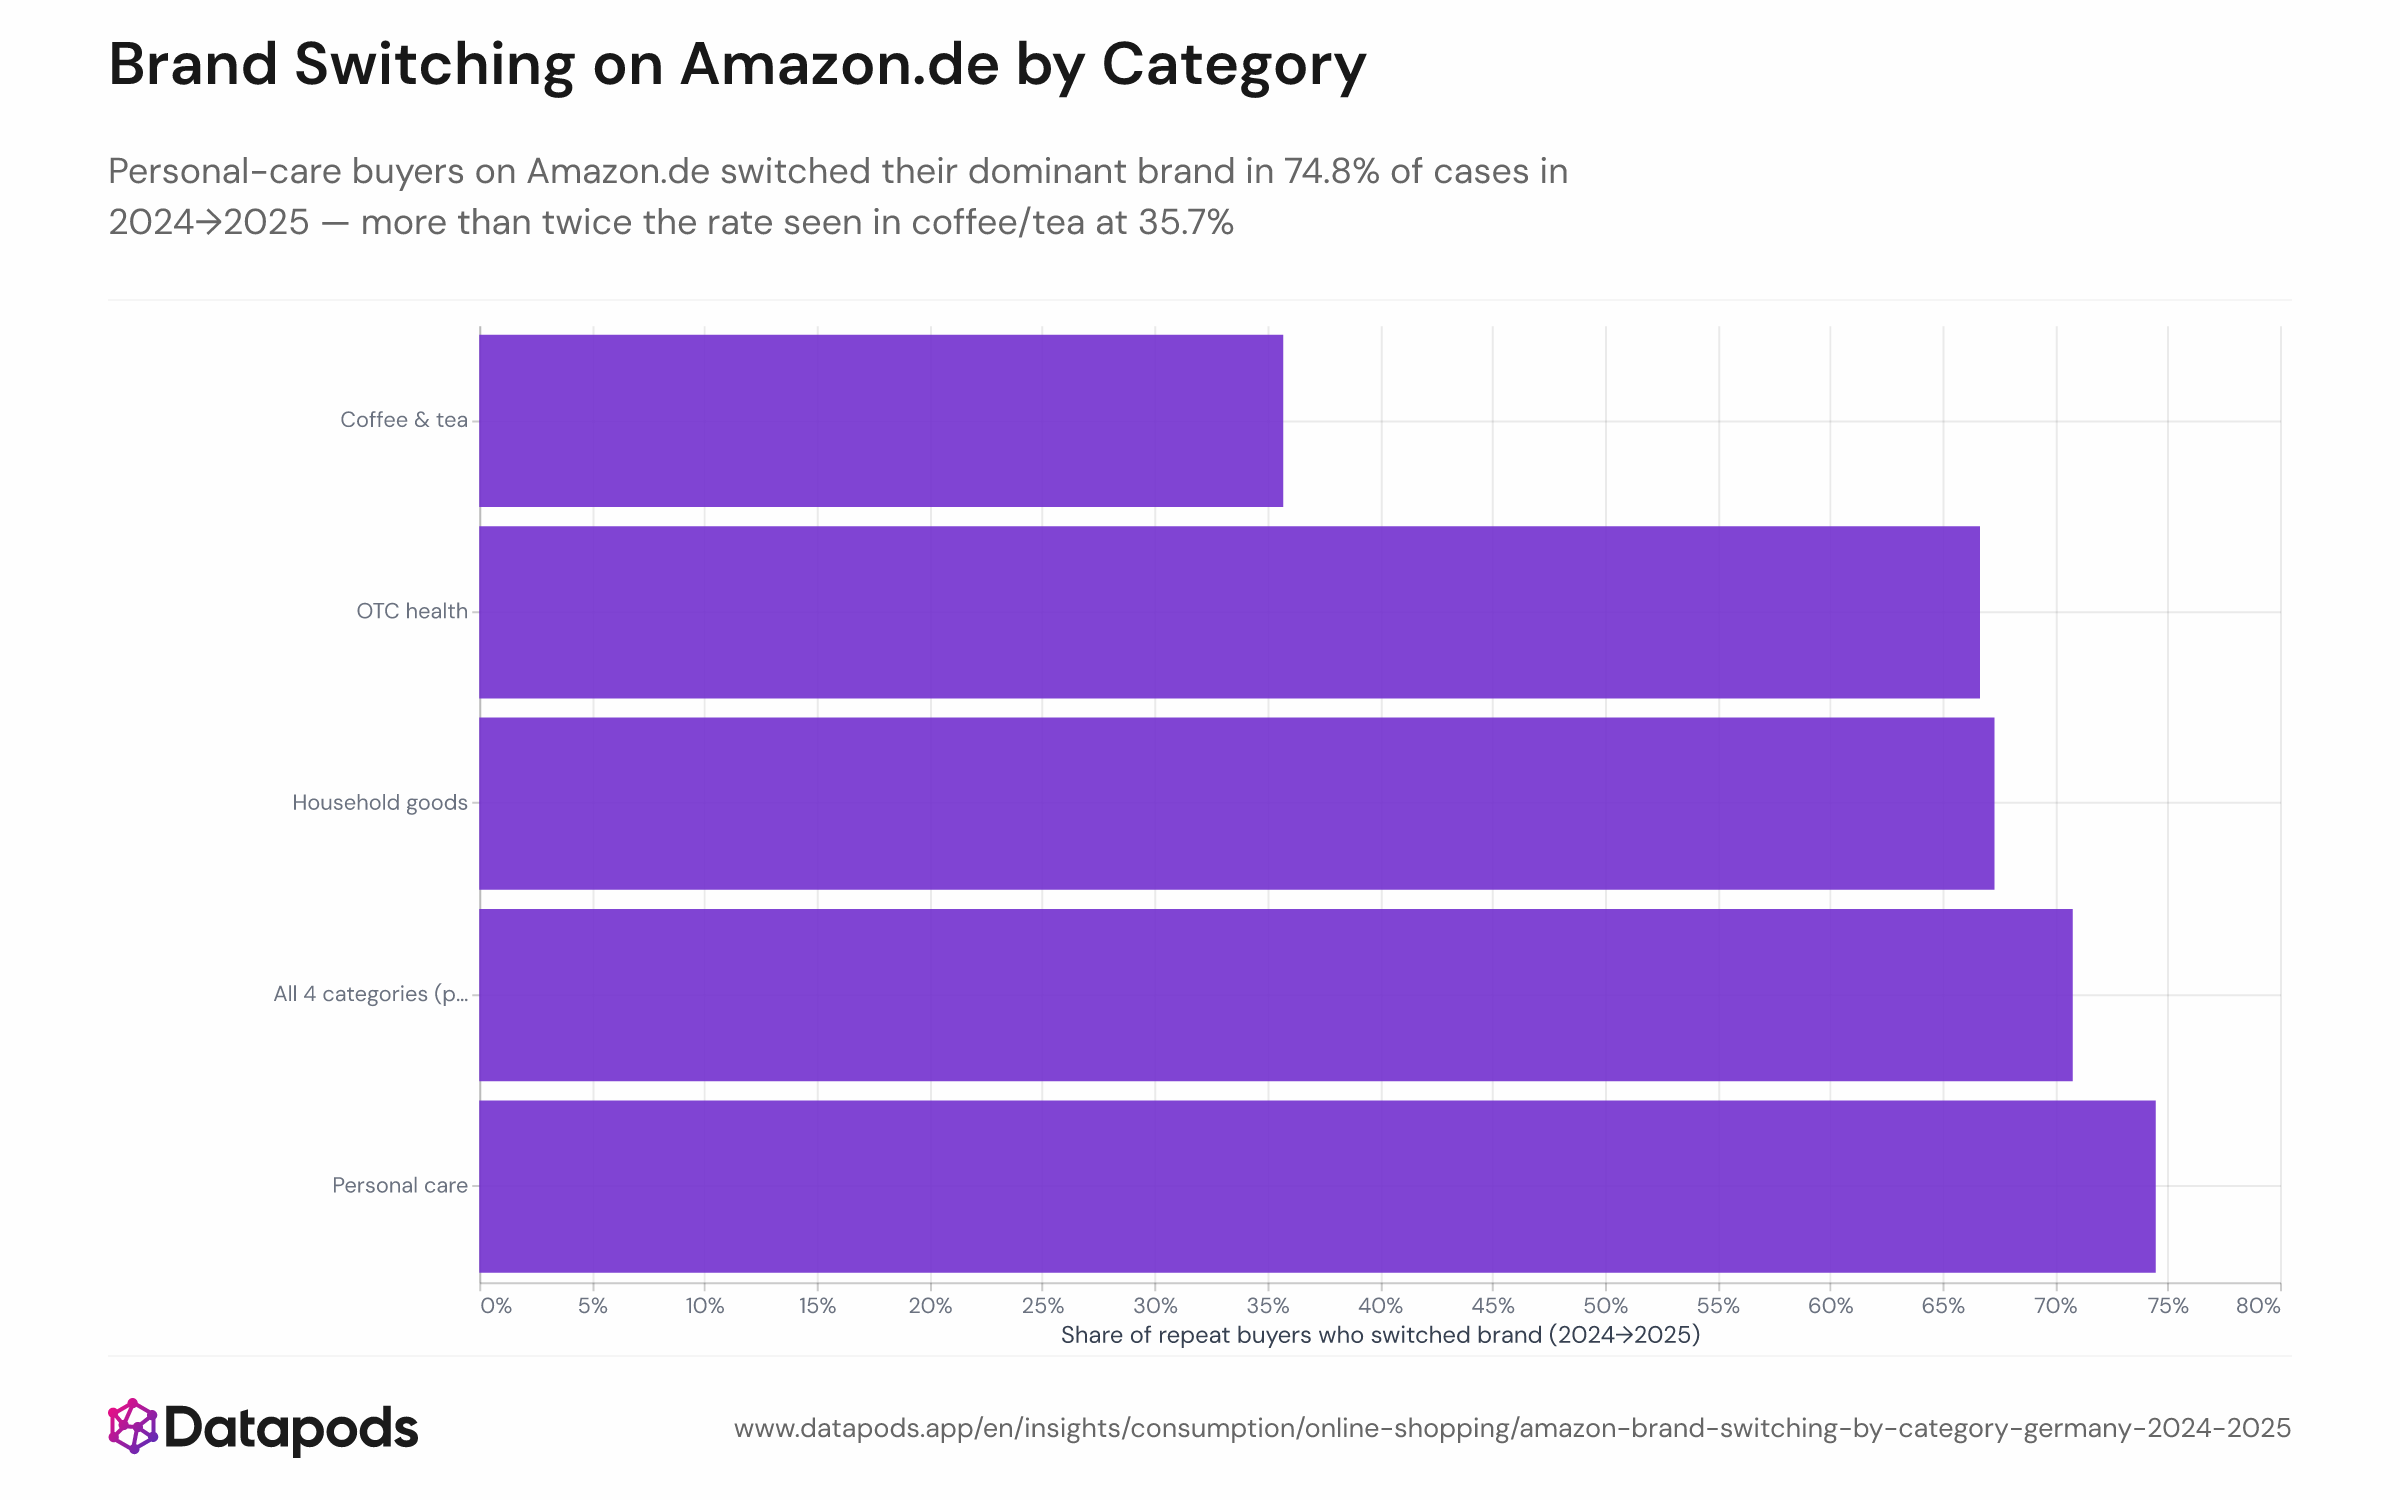
Brand Switching on Amazon.de by CategoryHorizontal bar chart showing the share of Amazon.de repeat-buyer–category pairs where the dominant brand changed between 2024 and 2025, broken down by everyday product category. Personal care leads at 74.8%; coffee/tea shows the lowest rate at 35.7%.Horizontal bar chart showing the share of Amazon.de repeat-buyer–category pairs where the dominant brand changed between 2024 and 2025, broken down by everyday product category. Personal care leads at 74.8%; coffee/tea shows the lowest rate at 35.7%.
Horizontal bar chart showing the share of Amazon.de repeat-buyer–category pairs where the dominant brand changed between 2024 and 2025, broken down by everyday product category. Personal care leads at 74.8%; coffee/tea shows the lowest rate at 35.7%.
Sample size
n = 267
Data date
2024–2025
Segment
All segments
Platform
Purchases
Market
Germany
Info
Sample size
n = 267
Data date
2024–2025
Segment
All segments
Platform
Purchases
Market
Germany

Analysis

Brand loyalty on Amazon.de is far from uniform: nearly three in four repeat personal-care buyers switched their dominant brand year-over-year in 2024–2025, while coffee and tea drinkers stayed comparatively faithful at a 35.7% switch rate. The gap — almost 40 percentage points between the most and least volatile categories — reveals how category dynamics, not a single macroeconomic force, determine churn.

Why personal care churns fastest

Personal care on Amazon.de sits in an especially competitive slot: private-label alternatives now account for roughly 39% of German grocery and FMCG value sales, and premium own-brand ranges grew +11.2% in revenue in 2025 versus 2024, giving shoppers a constantly expanding set of credible alternatives to incumbent brands. Coffee and tea, by contrast, tend to involve ritual, taste memory, and stronger habitual repurchase — traits that dampen switching even on a marketplace where price comparisons are instant. Brands in high-churn categories face a structural retention challenge that listing quality and assortment breadth cannot fully offset. See also how this category spread maps onto overall switch-rate trends in brand-switch trends over time.


This analysis is based on public segment data. For deeper cuts, use our Enterprise interface.

Related statistics

See all Online Shopping
  • Amazon.de Brand-Switch Rate by Quarter

    Q1 2024 – Q4 2025
  • Amazon.de Average Order Value by Age Group — 55+ vs. 25–44 Shoppers in Germany, 2025

    Q4 2024 – Q4 2025
  • Amazon.de Browsing Sessions by Device — 55+ vs. 25–44 Shoppers in Germany, 2024–2025

    2024–2025
  • Unlock deeper cuts

    Enterprise
See all Online Shopping

Methodology

The chart tracks German Amazon.de shoppers who made at least two orders per year in the same everyday product category in both 2024 and 2025. For each shopper–category pair, the dominant brand in each year was identified, and a switch was recorded when that dominant brand changed between the two years. Results are shown by category for the full 2024–2025 observation window.


These insights are based on the Datapods Panel. Our data comes exclusively from users who are compensated for their anonymity. Become part of the panel & earn from your data