Amazon Subscribe & Save vs. Non-Subscriber Repeat-Purchase Rate by Category — Germany 2025
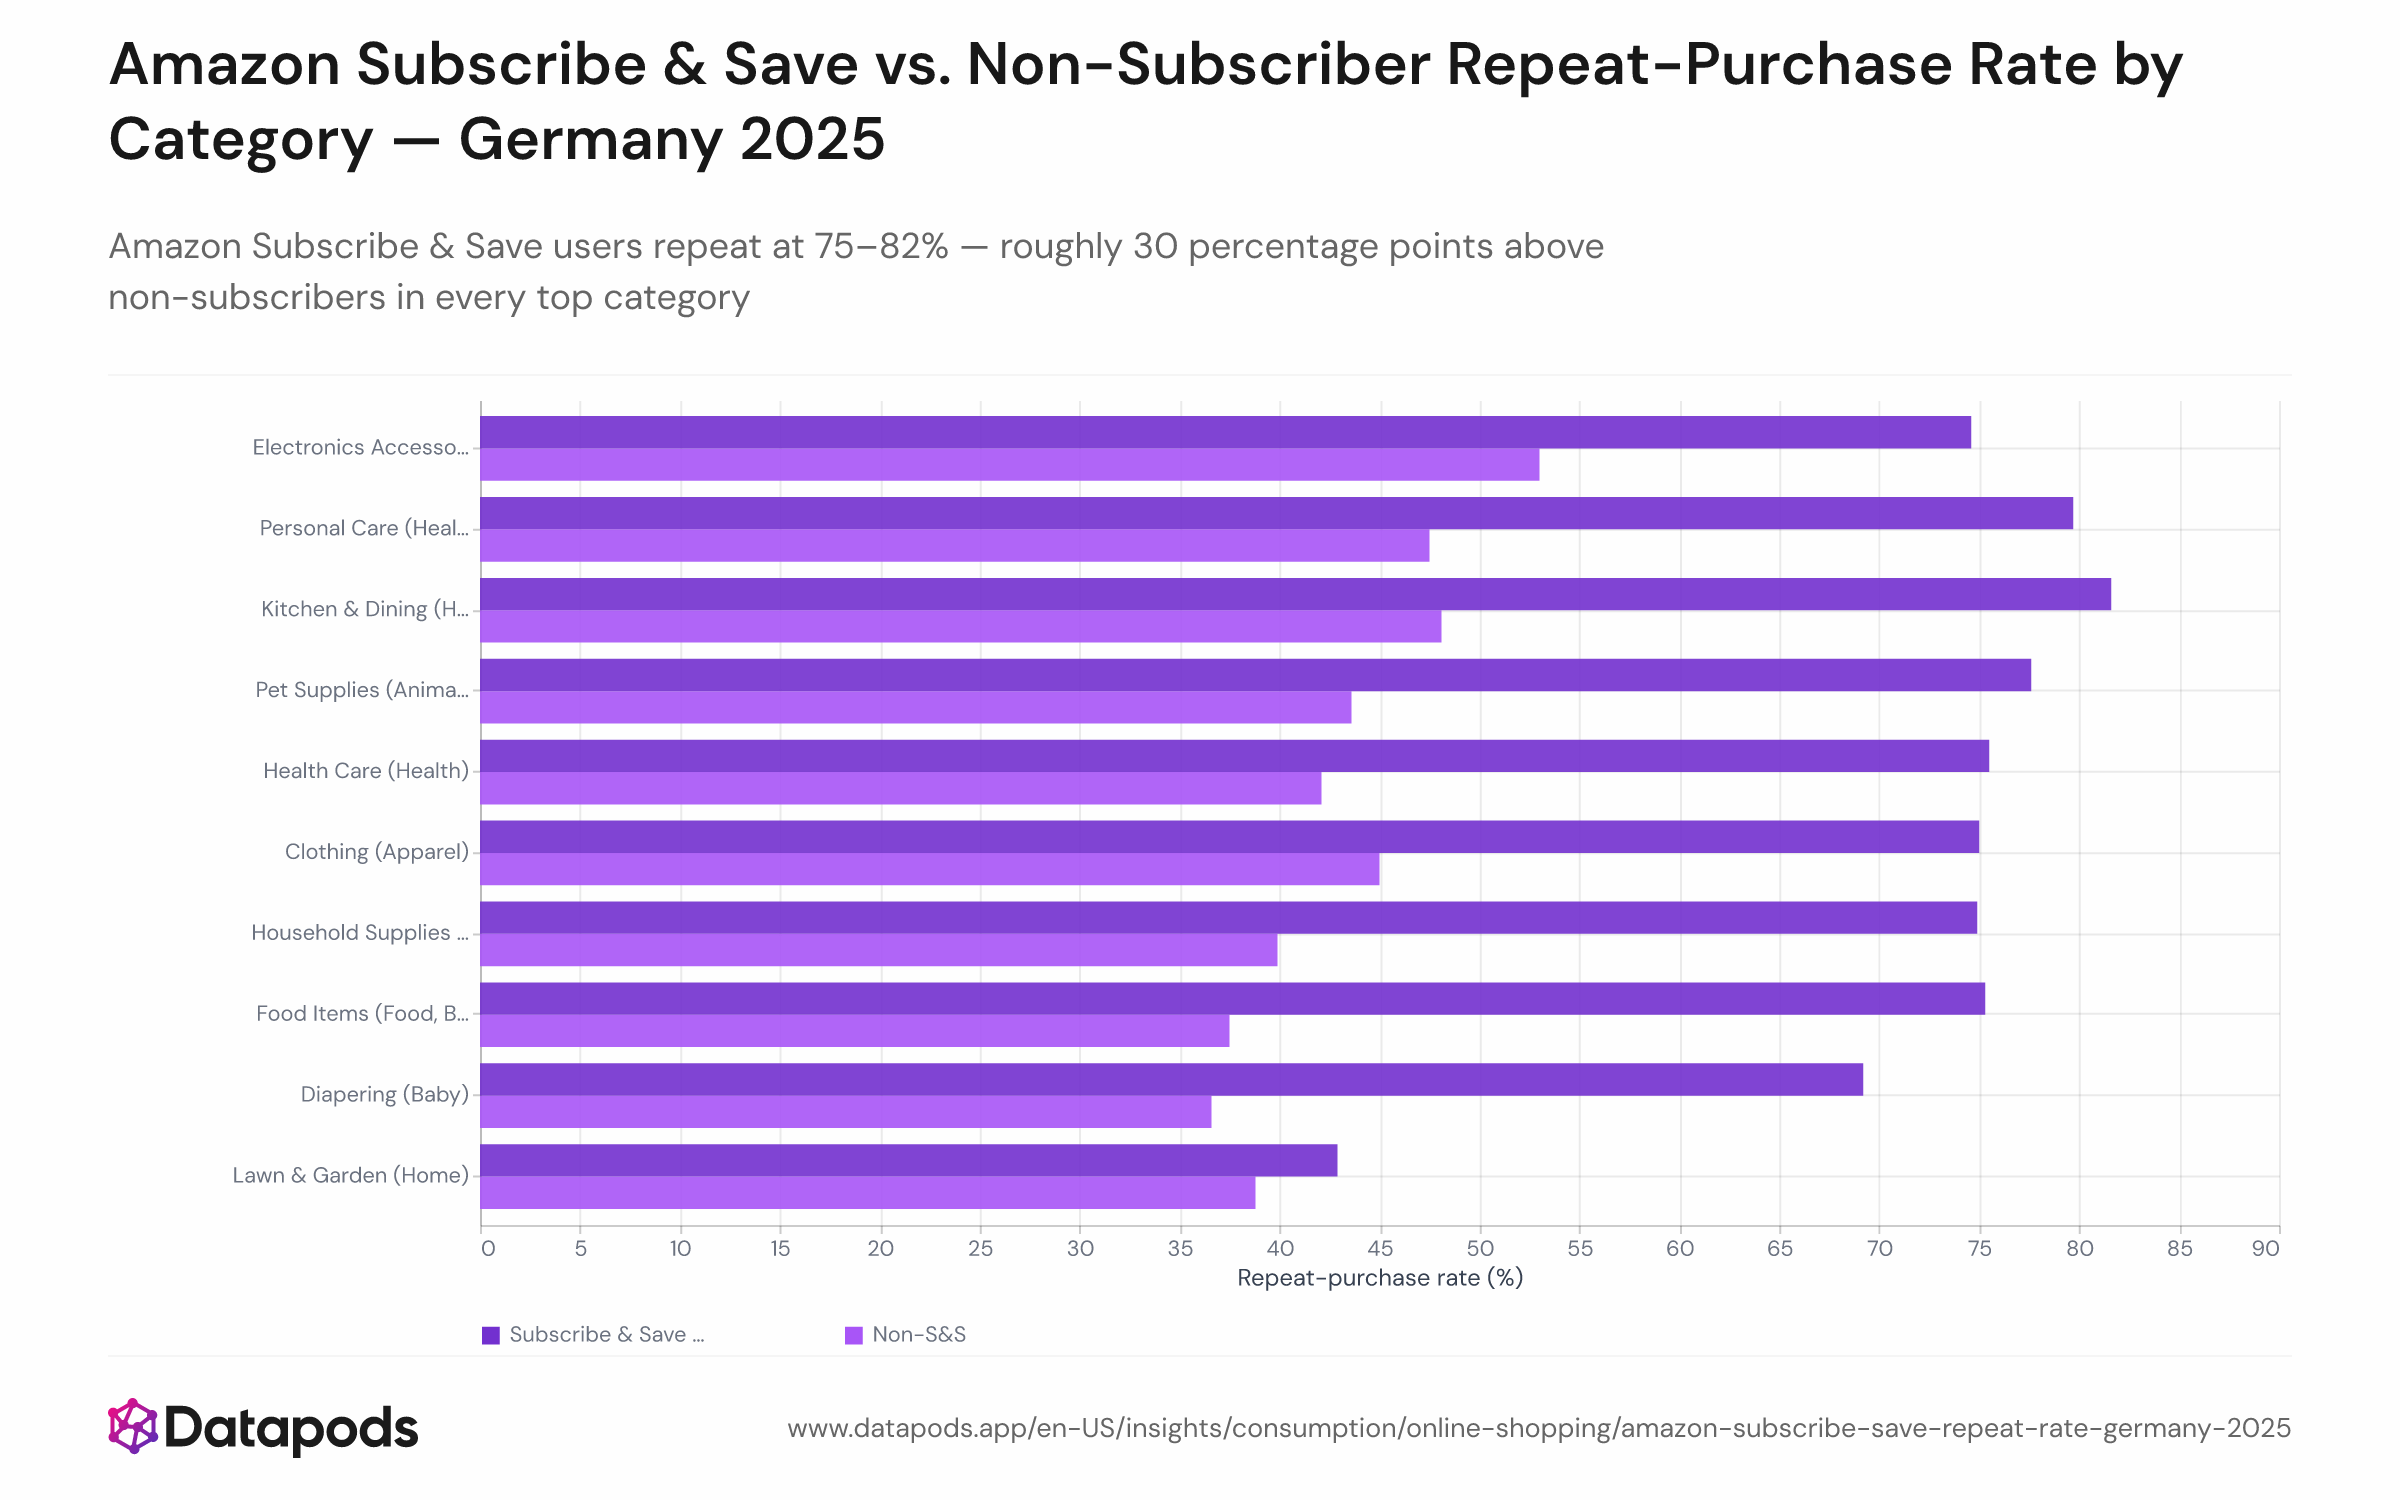
Review Full Year 2025: Amazon Subscribe & Save users repeat at 75–82% — roughly 30 percentage points above non-subscribers in every top category
Info
- Sample size
- n = 27,231
- Data date
- Full Year 2025
- Segment
- All segments
- Platform
- Amazon
- Market
- Germany
Analysis
Subscribe & Save enrollment produces the single largest observable lift in Amazon.de repeat-purchase behavior in 2025: subscribers repeat at 75–82% across every major consumable category, versus 37–53% for non-subscribers — a gap of 25–35 percentage points that holds consistently.
The subscription mechanic that redefines Kundenbindung on Amazon
Personal Care S&S users repeat at 80% versus 47% without a subscription; Kitchen & Dining subscribers hit 82% versus 48% for non-subscribers; Pet Supplies enrollees reach 78% against 44%. Subscribe & Save offers item discounts and the convenience of automatic deliveries, creating both a financial and a logistical lock-in that transforms occasional buyers into predictable recurring customers. The categories with the deepest S&S footprints on Amazon.de — Pet Supplies, Personal Care, Health Care, and Food Items — are precisely the ones where the subscription mechanic has the most anchoring power on Amazon Wiederholungskäufe. One notable outlier is Clothing, which ranks 6th overall for repeat rate (45%) but has near-zero S&S enrollment; its loyalty is driven entirely by category preference rather than subscription mechanics. For context on which categories carry the highest baseline repeat-purchase rates before the S&S effect, see the full category ranking.
This analysis is based on public segment data. For deeper cuts, use our Enterprise interface.
Methodology
Buyers are classified as Subscribe & Save users if they hold any active or previously canceled S&S subscription whose product matches the same level-2 product category as the orders being analyzed. The repeat-purchase rate is then computed separately for S&S and non-S&S buyers within each top-10 category, using the same 90-day second-order window applied throughout. Cells with fewer than 5 buyers in either group are excluded. The S&S match rate across subscription records is 87%. Categories with very few S&S enrollees (notably Lawn & Garden and Clothing) carry higher variance and should be interpreted with caution.