Nachrichten-Anteil am wöchentlichen TikTok-Konsum unter Nachrichten-Followern — Deutschland 2025
Ergebnisse vom
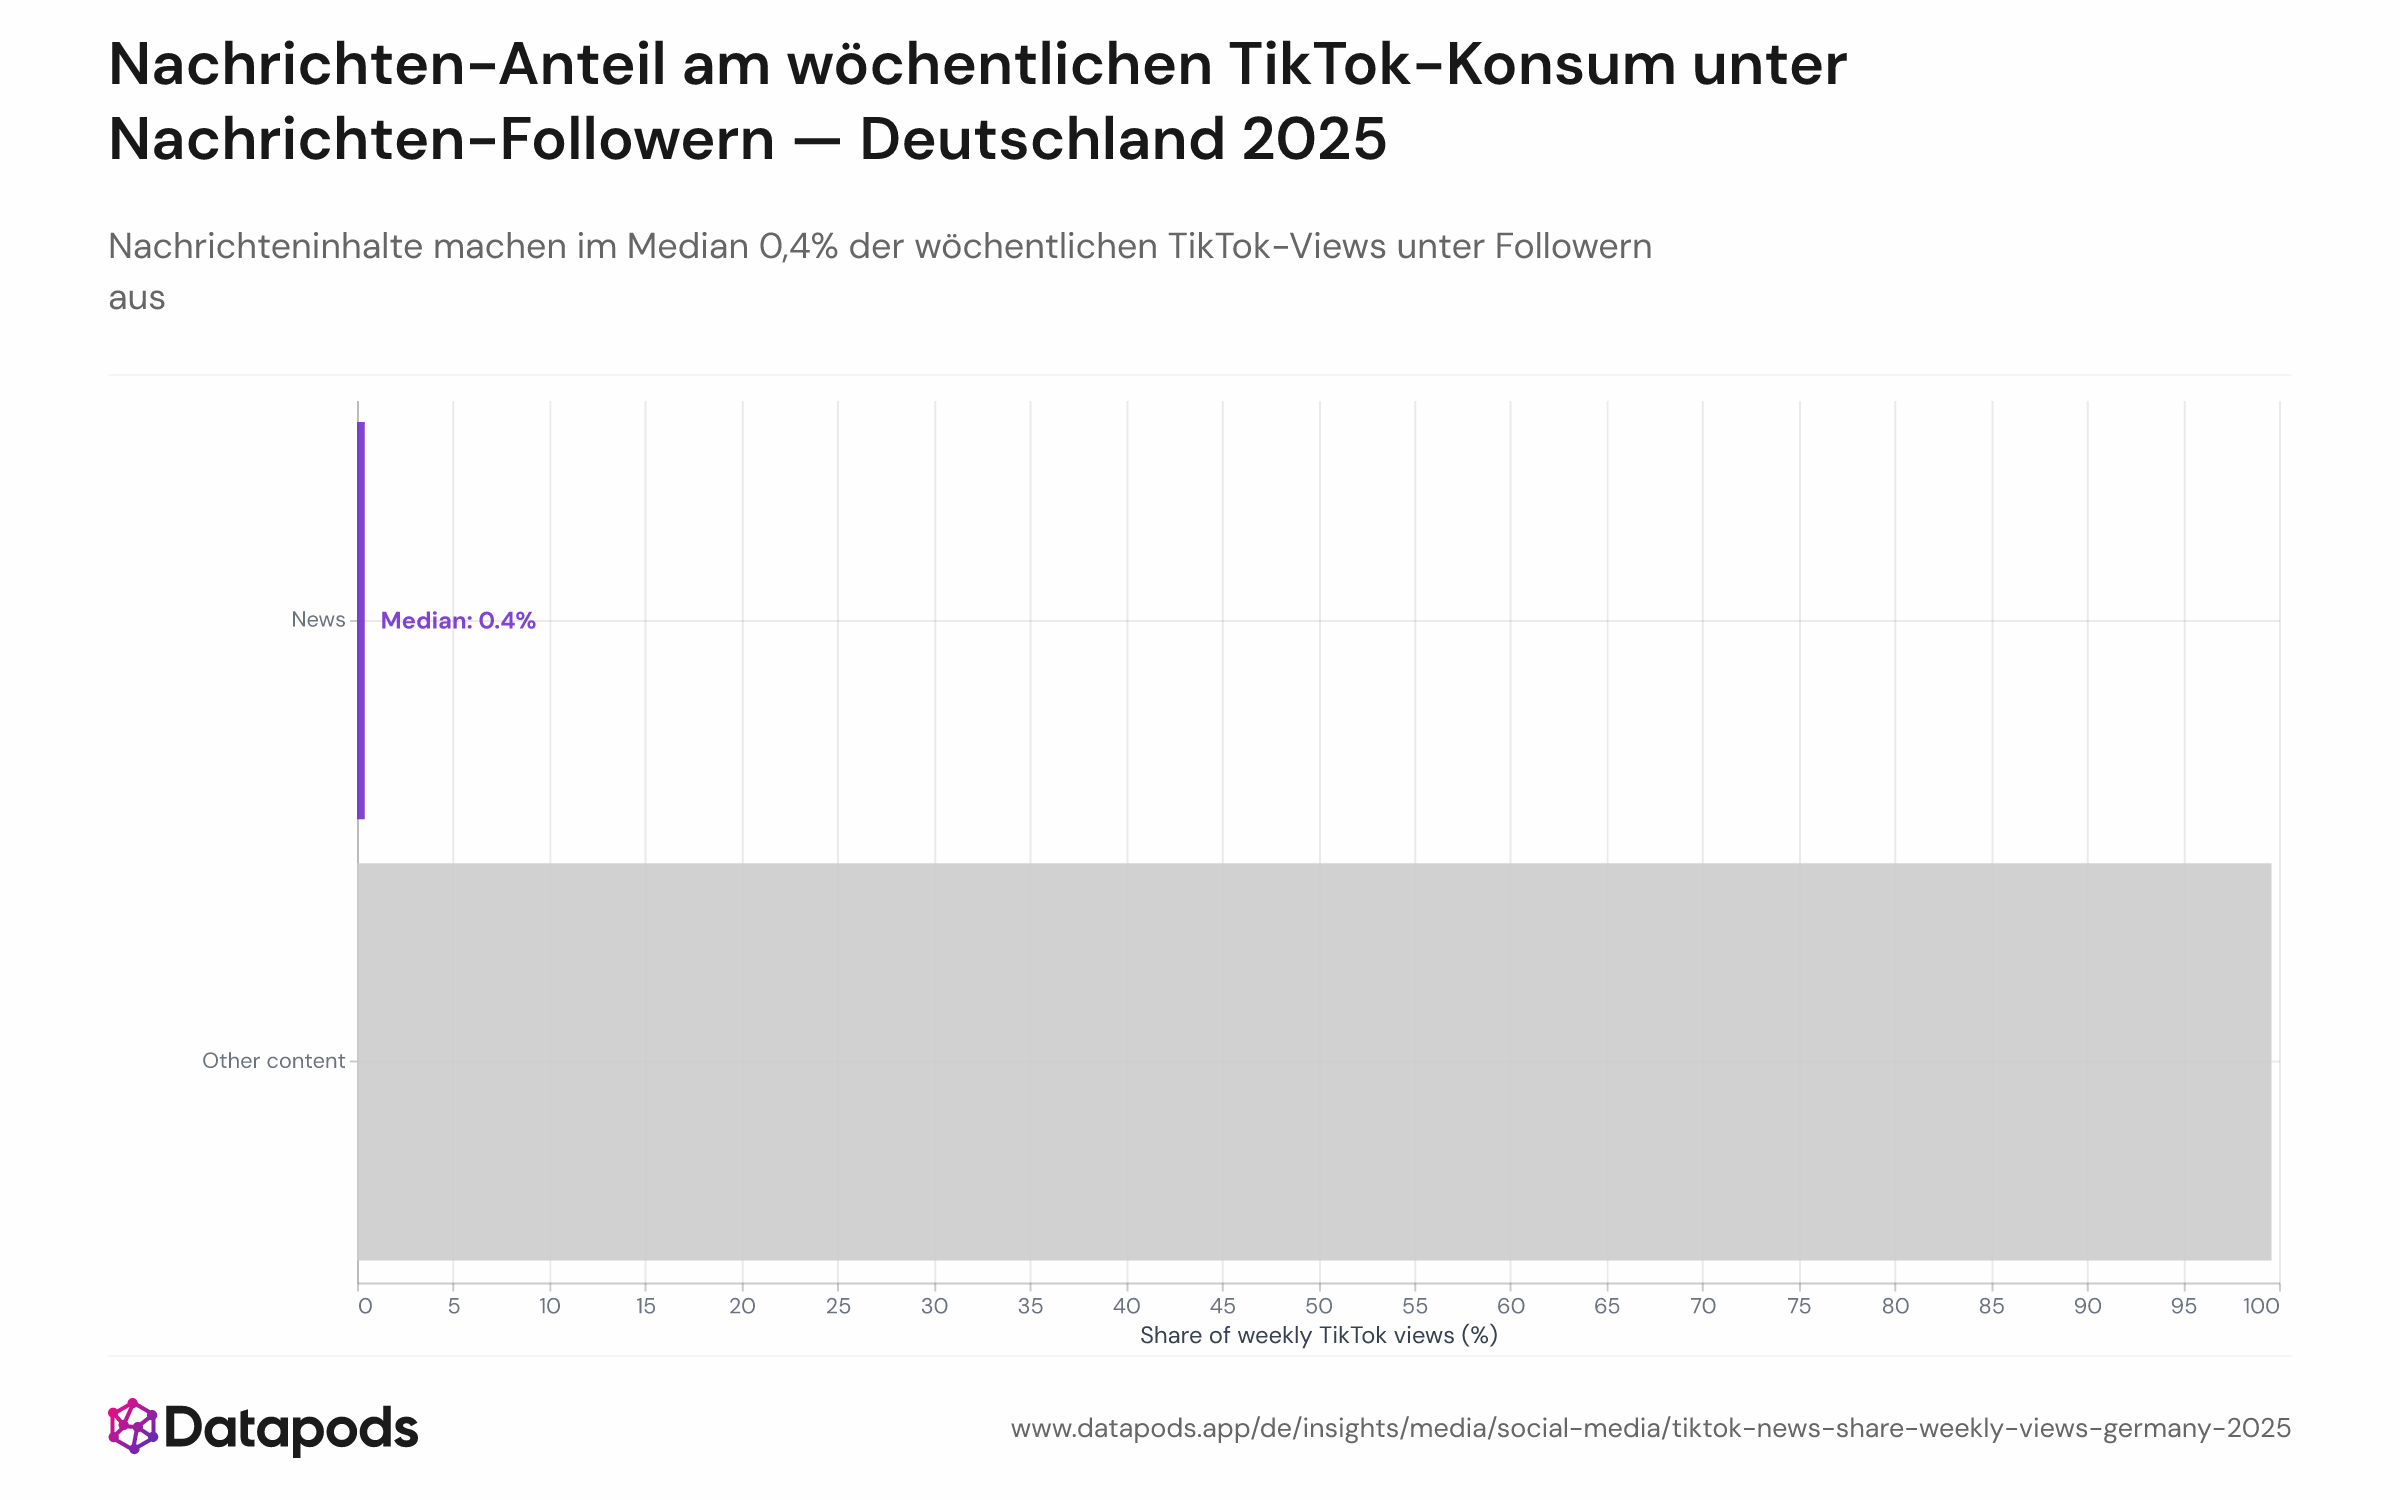
Bilanz 2025: Nachrichteninhalte machen im Median 0,4% der wöchentlichen TikTok-Views unter Followern aus
Nachrichten-Anteil am wöchentlichen TikTok-Konsum unter Nachrichten-Followern — Deutschland 2025Distribution chart showing the per-user share of news content in weekly TikTok views among news followers. The median is 0.4%, with an interquartile range of 0.2%–0.8%, and a long tail extending toward higher shares. The chart illustrates that even among dedicated news followers, entertainment, lifestyle, and comedy dominate the platform's feed.
This structural dominance reflects <cite index="27-3,27-13">TikTok's algorithm emphasis on watch time as the centre of performance, with ICUC recommending optimizing for watch time (around 75% of video duration) as a directional benchmark</cite>. While news and entertainment achieve parity in watch-through rates (Chart 2), news remains algorithmically marginal because the platform's feed is optimized for viral, short-form entertainment. News followers on TikTok are primarily scrolling entertainment; news is a secondary discovery channel, not their primary reason for opening the app.
Distribution chart showing the per-user share of news content in weekly TikTok views among news followers. The median is 0.4%, with an interquartile range of 0.2%–0.8%, and a long tail extending toward higher shares. The chart illustrates that even among dedicated news followers, entertainment, lifestyle, and comedy dominate the platform's feed.
This structural dominance reflects <cite index="27-3,27-13">TikTok's algorithm emphasis on watch time as the centre of performance, with ICUC recommending optimizing for watch time (around 75% of video duration) as a directional benchmark</cite>. While news and entertainment achieve parity in watch-through rates (Chart 2), news remains algorithmically marginal because the platform's feed is optimized for viral, short-form entertainment. News followers on TikTok are primarily scrolling entertainment; news is a secondary discovery channel, not their primary reason for opening the app.
Info
Stichprobengröße
n = 1.893
Datenstand
2025
Segment
Alle Segmente
Plattform
TikTok
Markt
Deutschland
Analyse
Trotz des Folgens von Nachrichten-Accounts und regelmäßigem Nachrichtenkonsum widmen deutsche TikTok-Nutzer:innen minimale Bildschirmzeit Nachrichten im Verhältnis zu ihrem Gesamtkonsum. Nachrichten-Accounts machen median nur 0,4% der wöchentlichen Views aus—mit den meisten Nutzer:innen zwischen 0,2% und 0,8% (Interquartil-Spanne). Der Befund unterstreicht TikToks fundamentale Identität als eine Unterhaltungs-erst-Plattform, auf der News selbst für engagierte Nachrichten-Follower eine ergänzende, nicht primäre Inhaltskategorie bleibt.
Diese Analyse basiert auf öffentlichen Segmentdaten. Für tiefergehende Einblicke nutzen Sie unsere Enterprise-Schnittstelle.
Pro-Nutzer-Anteil von News-Views an allen metadaten-klassifizierten angesehenen Videos während 2025. Nutzer:innen mit weniger als 50 total erfassten Views ausgeschlossen, um aussagekräftige Anteilsberechnungen zu gewährleisten. Nachrichten klassifiziert über author_username-Abgleich gegen die kuratierte 99-Marken-Allowlist. Median über 1.893 Nachrichten-Follower mit ausreichender Tracking-Abdeckung berechnet. Interquartil-Spanne (25.–75. Perzentil) zeigt die Verteilung.