Amazon.de Order-Rate Lift by YouTube Video Category in Germany — 2025
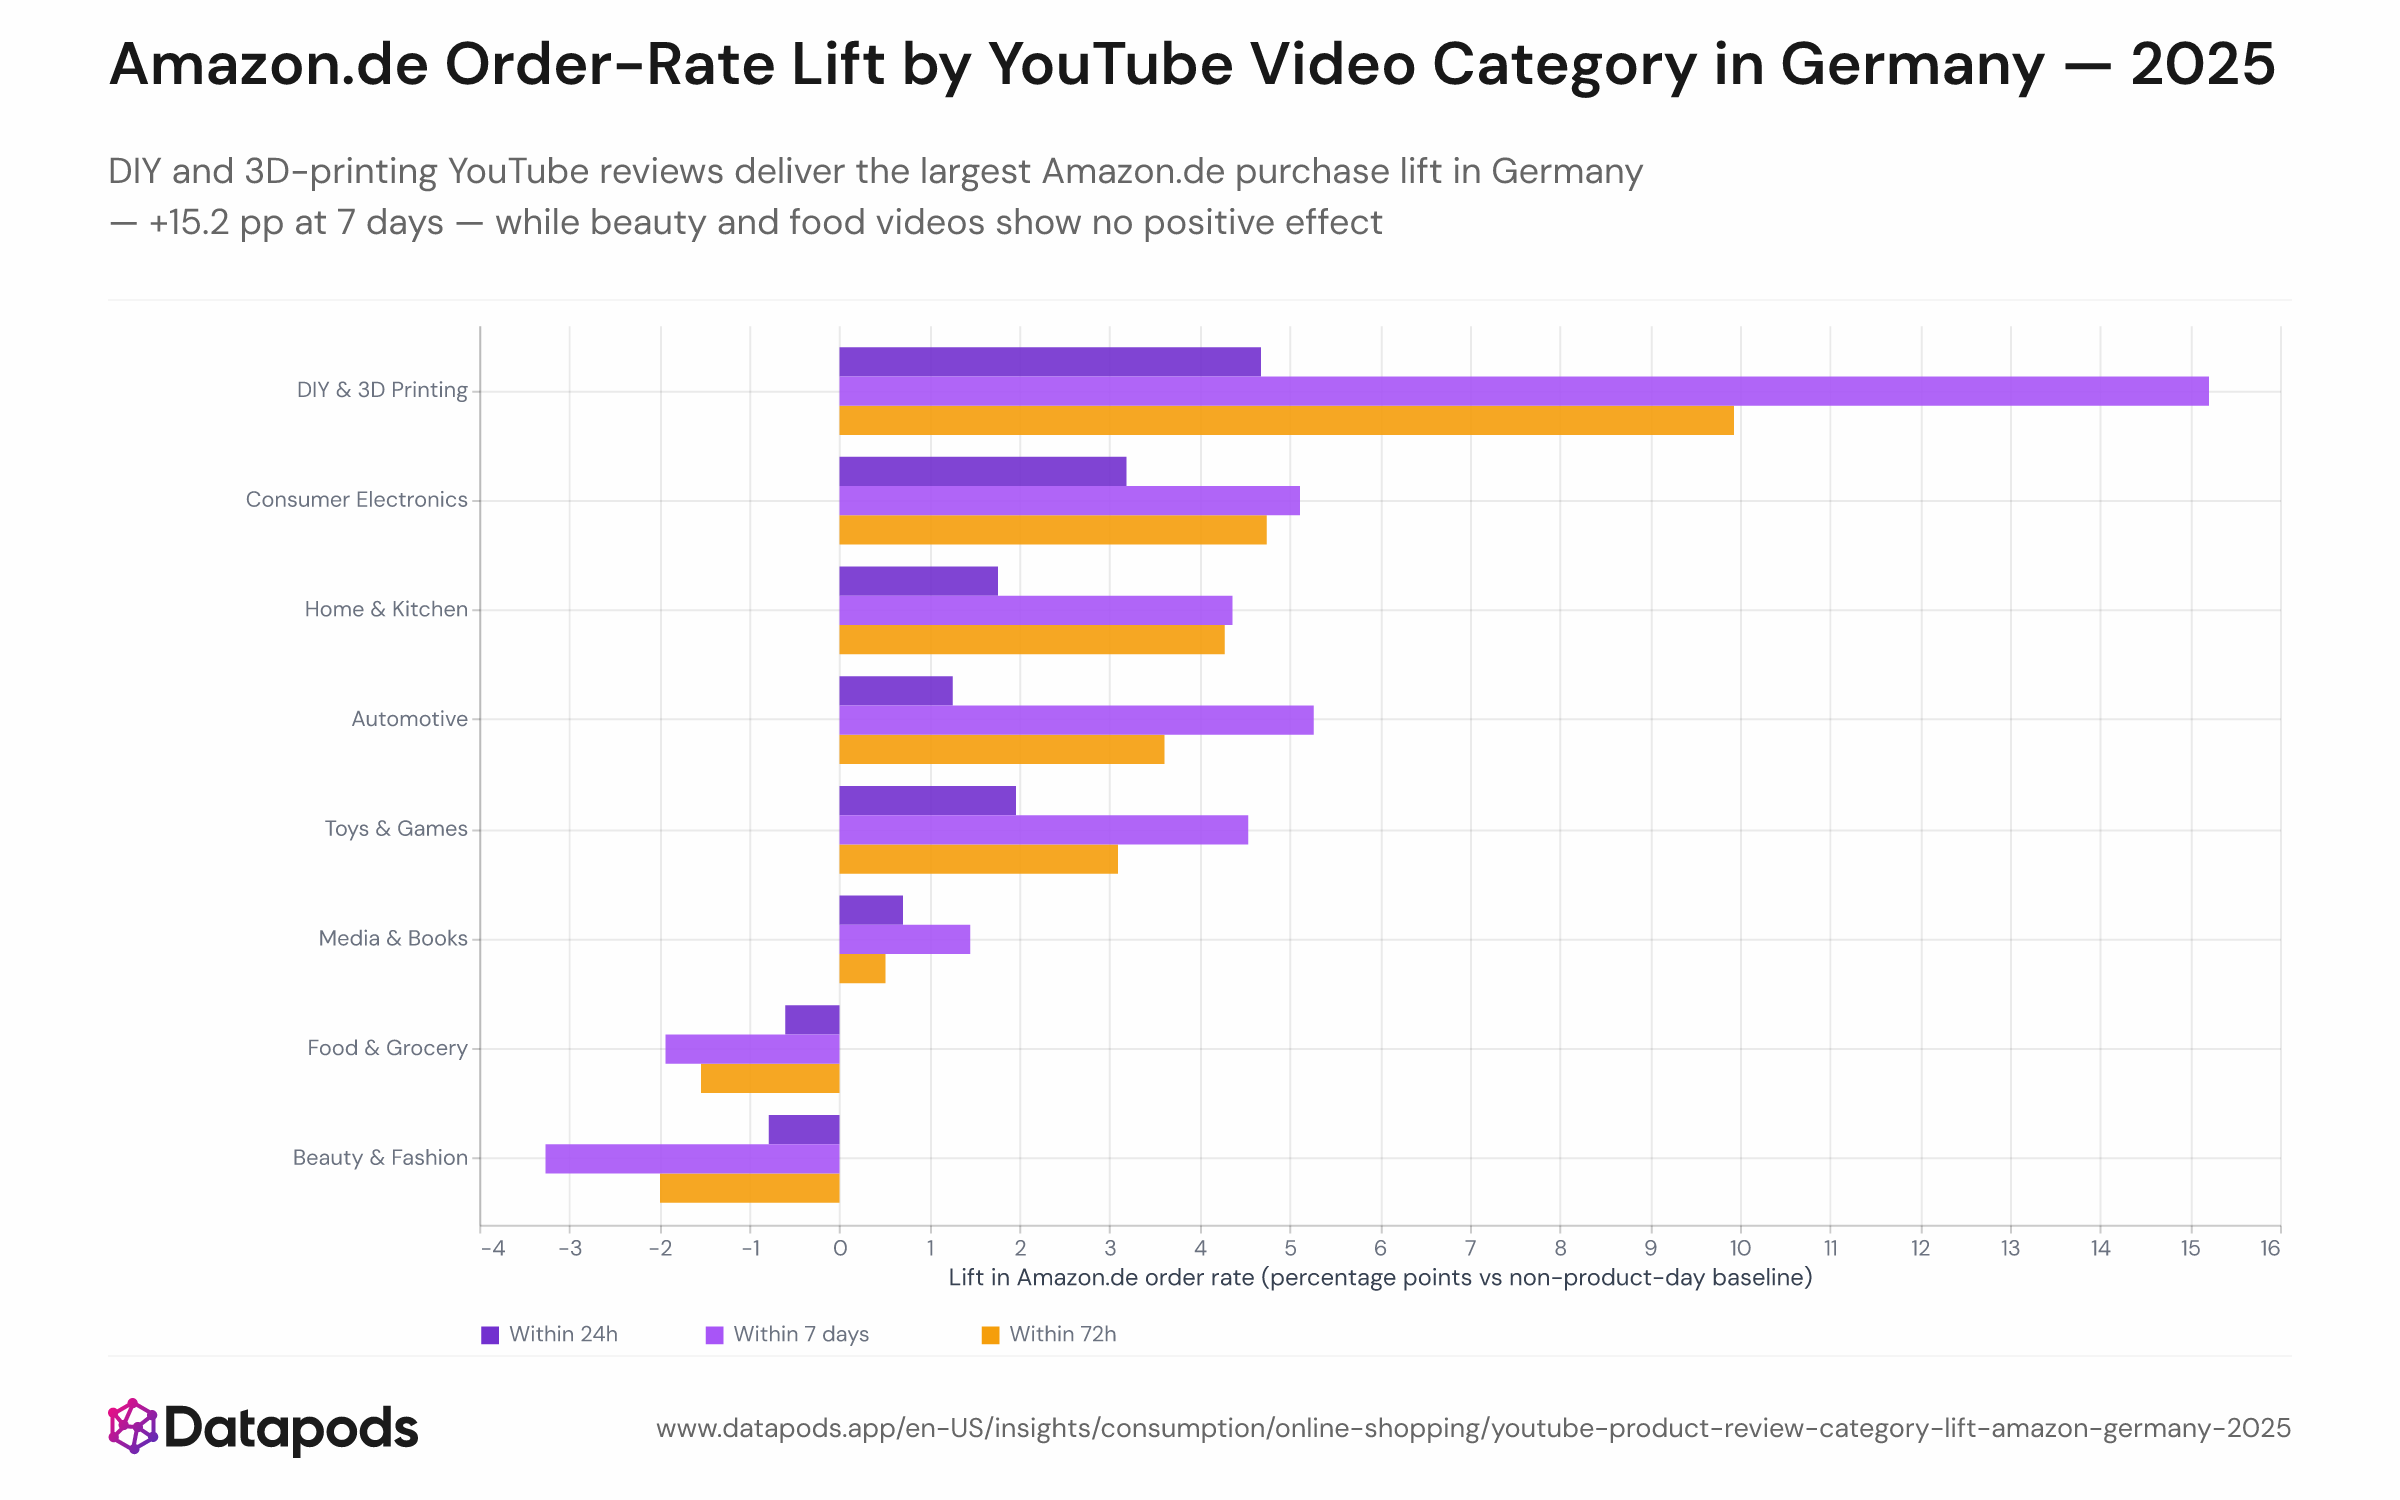
Review 2025: DIY and 3D-printing YouTube reviews deliver the largest Amazon.de purchase lift in Germany — +15.2 pp at 7 days — while beauty and food videos show no positive effect
Info
- Sample size
- n = 5,595
- Data date
- 2025
- Segment
- All segments
- Platform
- Amazon, YouTube
- Market
- Germany
Analysis
Not all YouTube product content drives Amazon.de purchases equally: DIY and 3D-printing reviews produce a remarkable +15.2 percentage-point lift in 7-day Amazon.de order rates over the non-product baseline, nearly three times larger than the next-strongest category. Consumer electronics (+5.1 pp), automotive (+5.2 pp), and toys & games (+4.5 pp) also show robust positive effects across all time windows.
Why DIY and Electronics Convert — and Beauty Doesn't
DIY and 3D-printing content sits at the intersection of research-heavy decision-making and Amazon.de's strong hardware and component inventory — buyers researching a new Bambu Lab printer or filament spool have few competing channels for those purchases in Germany. Consumer electronics and automotive accessories follow the same logic: Amazon.de is a credible, price-competitive destination for these categories, and YouTube creators who review gadgets routinely link directly to Amazon listings. Beauty and fashion YouTube content, by contrast, produces a negative short-term lift at 24 h (−0.9 pp for beauty/fashion, −0.6 pp for food/grocery). Germany's beauty market is dominated by Douglas, Sephora, Flaconi, and Zalando — specialist channels where brand curation and premium experience drive conversion — while grocery purchases route through supermarket apps and delivery platforms. The absence of an Amazon.de lift for these creators does not mean no purchase was triggered; it means the purchase went elsewhere. Brands in hardware, electronics, and maker categories stand to gain the most from YouTube video content strategies targeting German audiences. The overall 24-hour video-to-purchase effect is detailed in the headline conversion chart.
This analysis is based on public segment data. For deeper cuts, use our Enterprise interface.
Methodology
The same German online shopper cohort from 2025 is used as in the headline conversion analysis. Each viewing day is assigned to a content category based on the titles of the YouTube videos watched that day — keywords identify categories including DIY/3D-printing, consumer electronics, home/kitchen, automotive, toys & games, food/grocery, and beauty/fashion. The lift shown for each category is the percentage-point gap between that category's product-content viewing day order rate and the cohort-wide non-product-content baseline rate (7.0% / 16.6% / 29.0% at 24h / 72h / 7 days). Categories with too few product-content viewing days and a residual mixed/unclassified bucket are excluded from the chart.